Gallery
- Examples of applications developed by our research software engineers
NEXUS SWM Data Visualization Tools (Purdue-UNSA project)
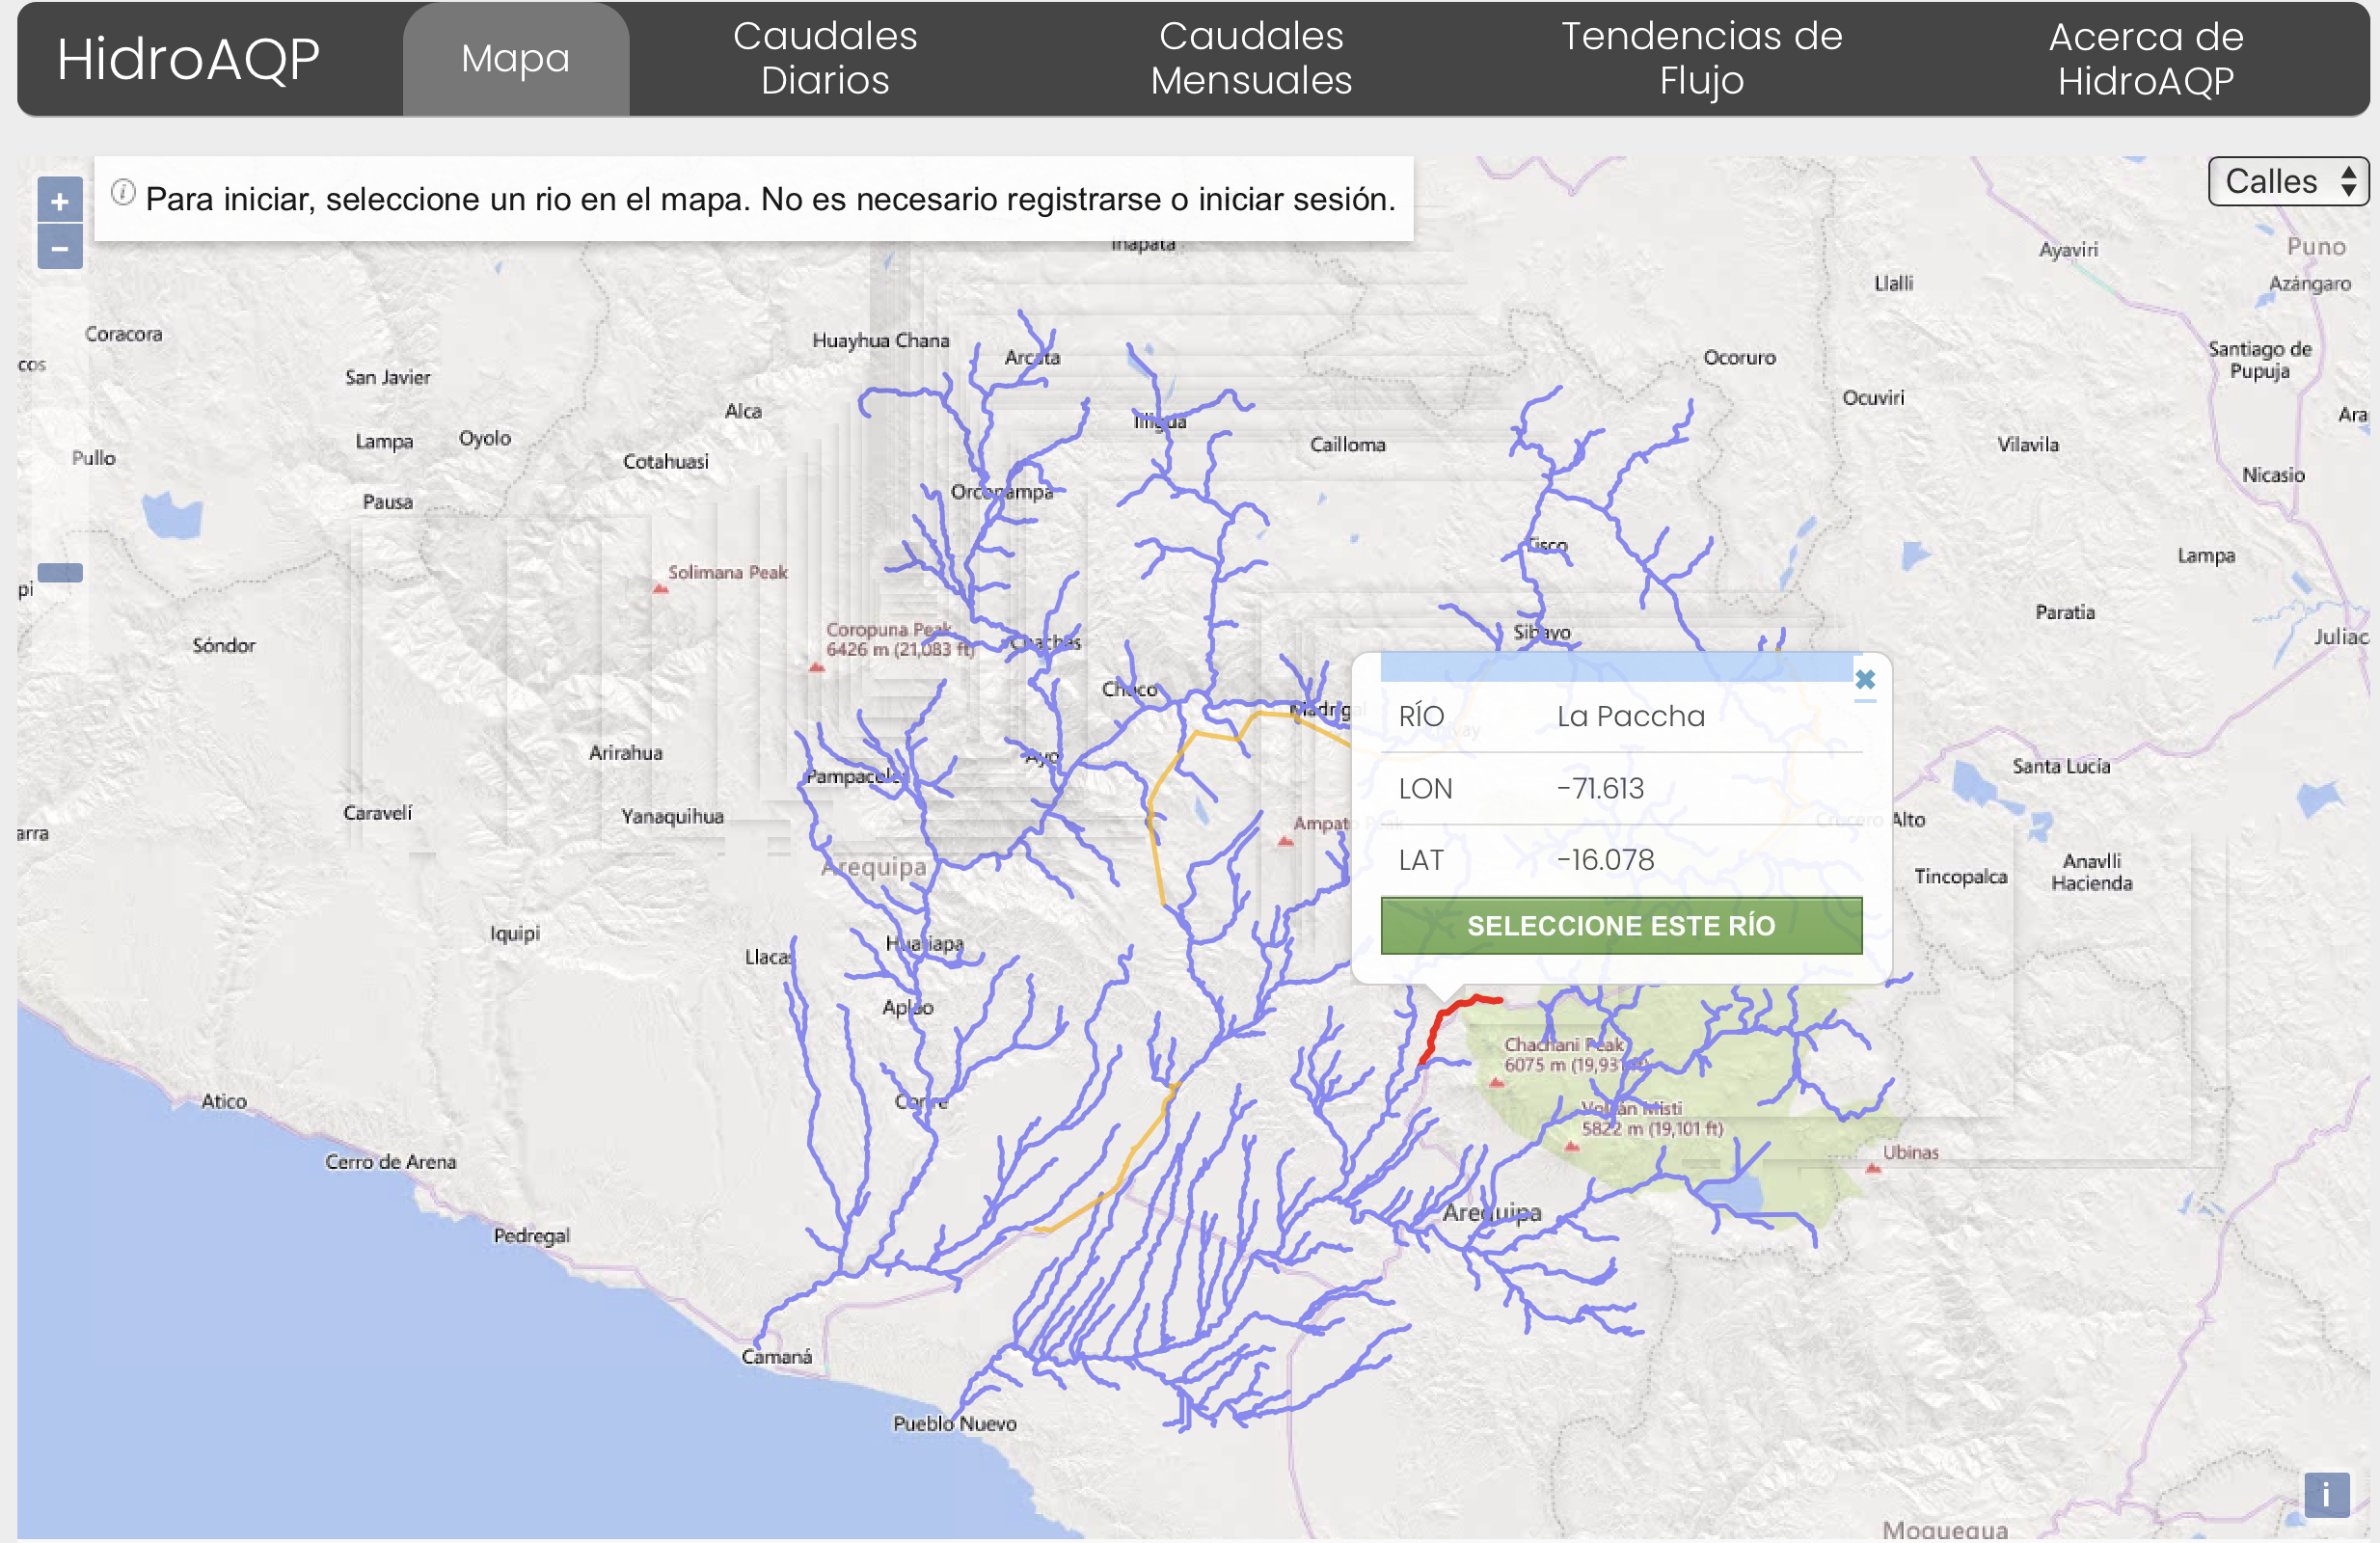
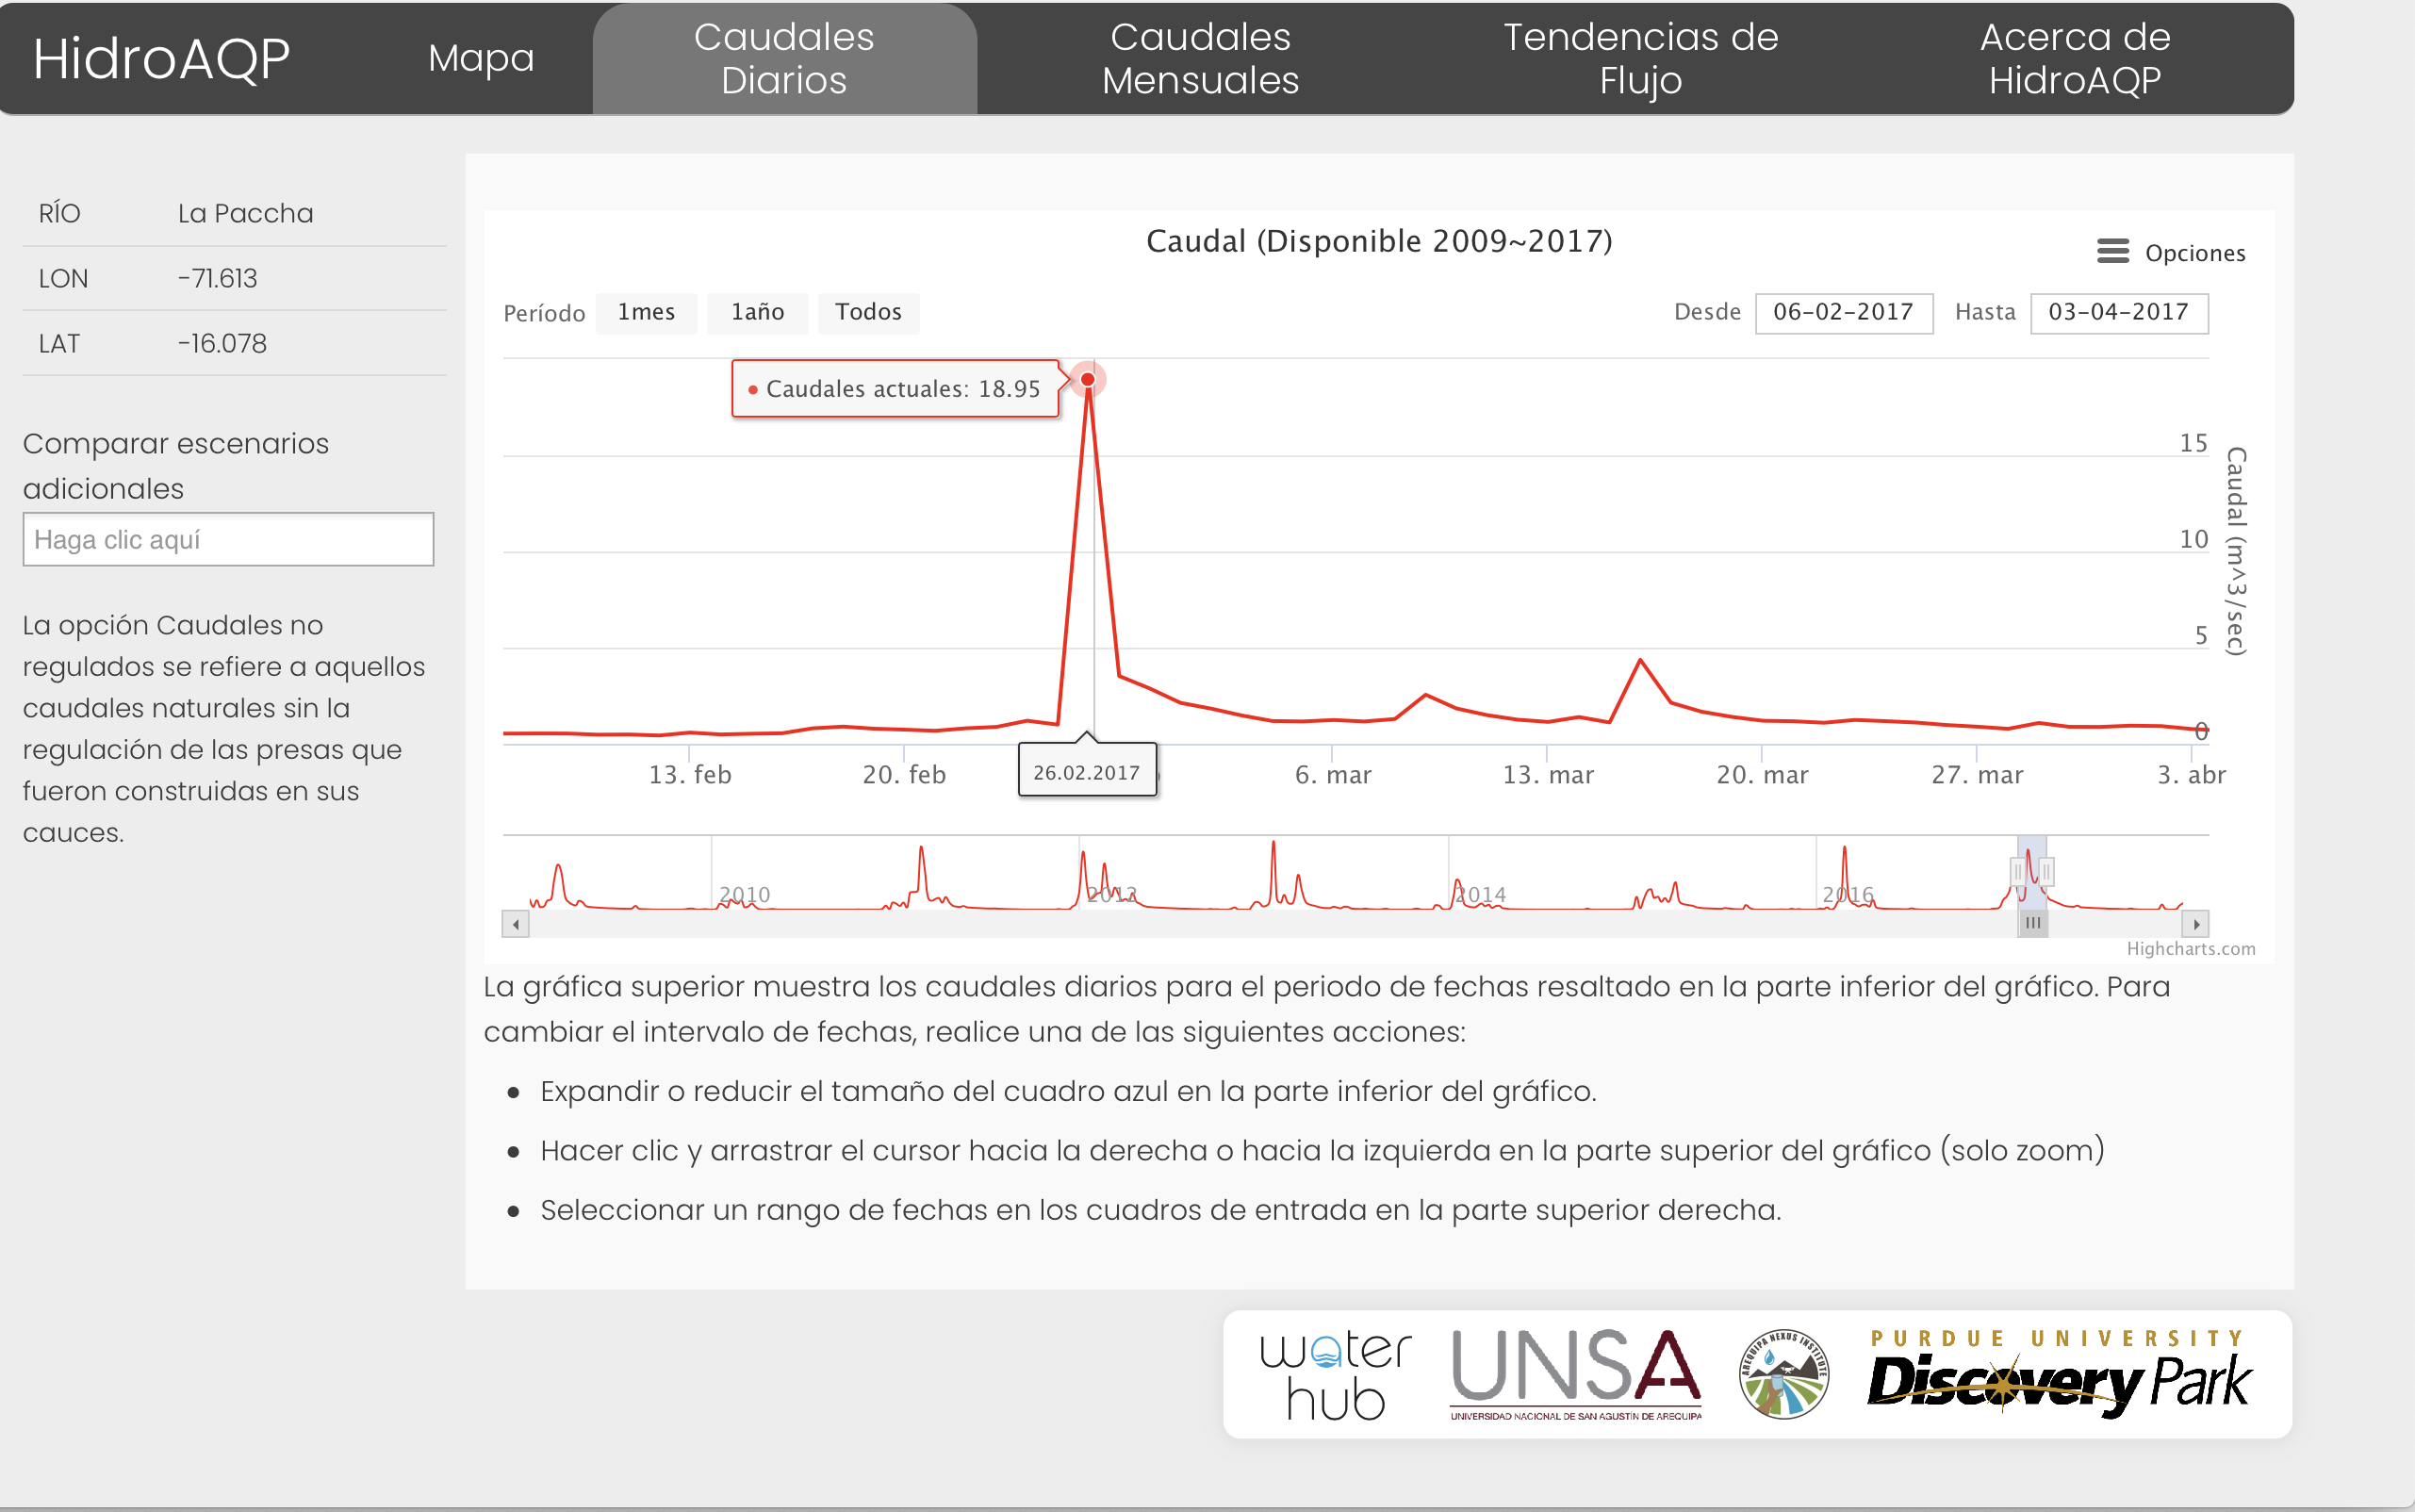
HydroAQP
Technology: JavaScript, Highchart, OpenLayer
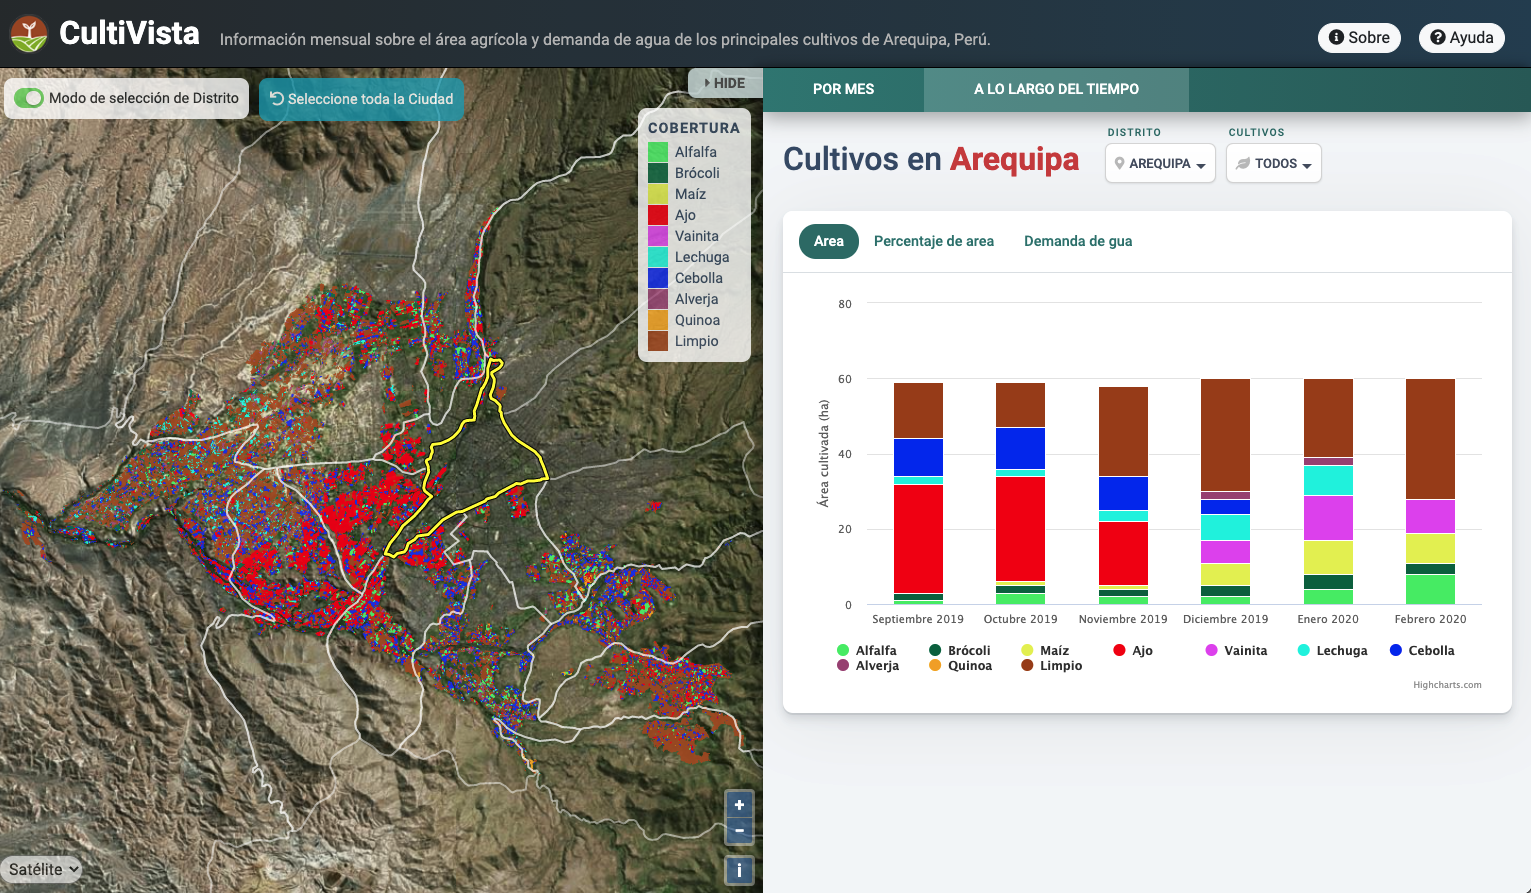
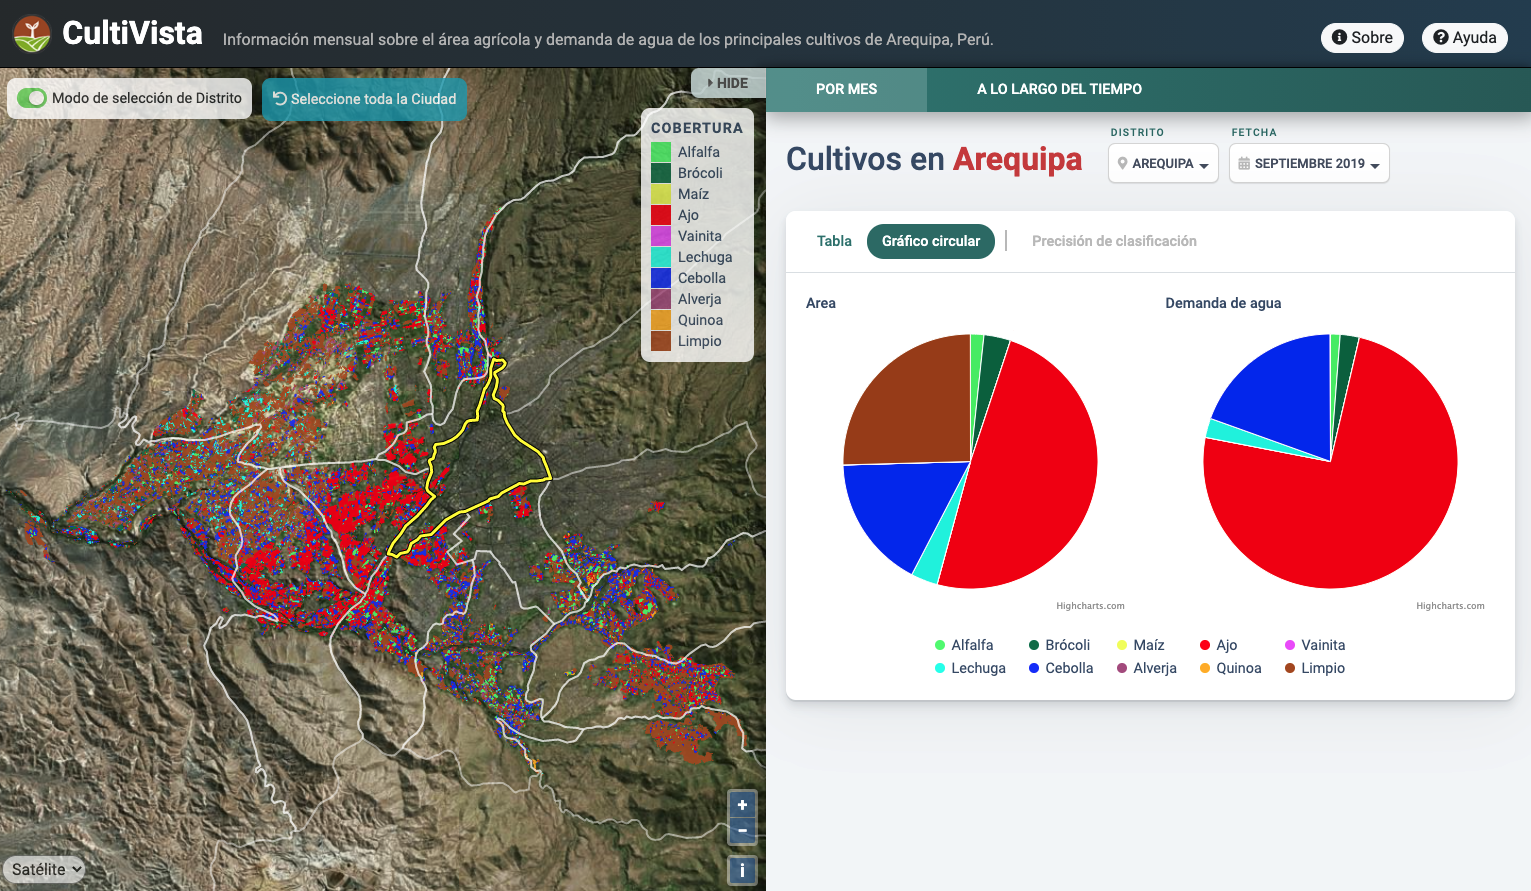
Crop Monitoring Tool (Cultivista)
Technology: JavaScript, Highchart, OpenLayer, BootStrap 4
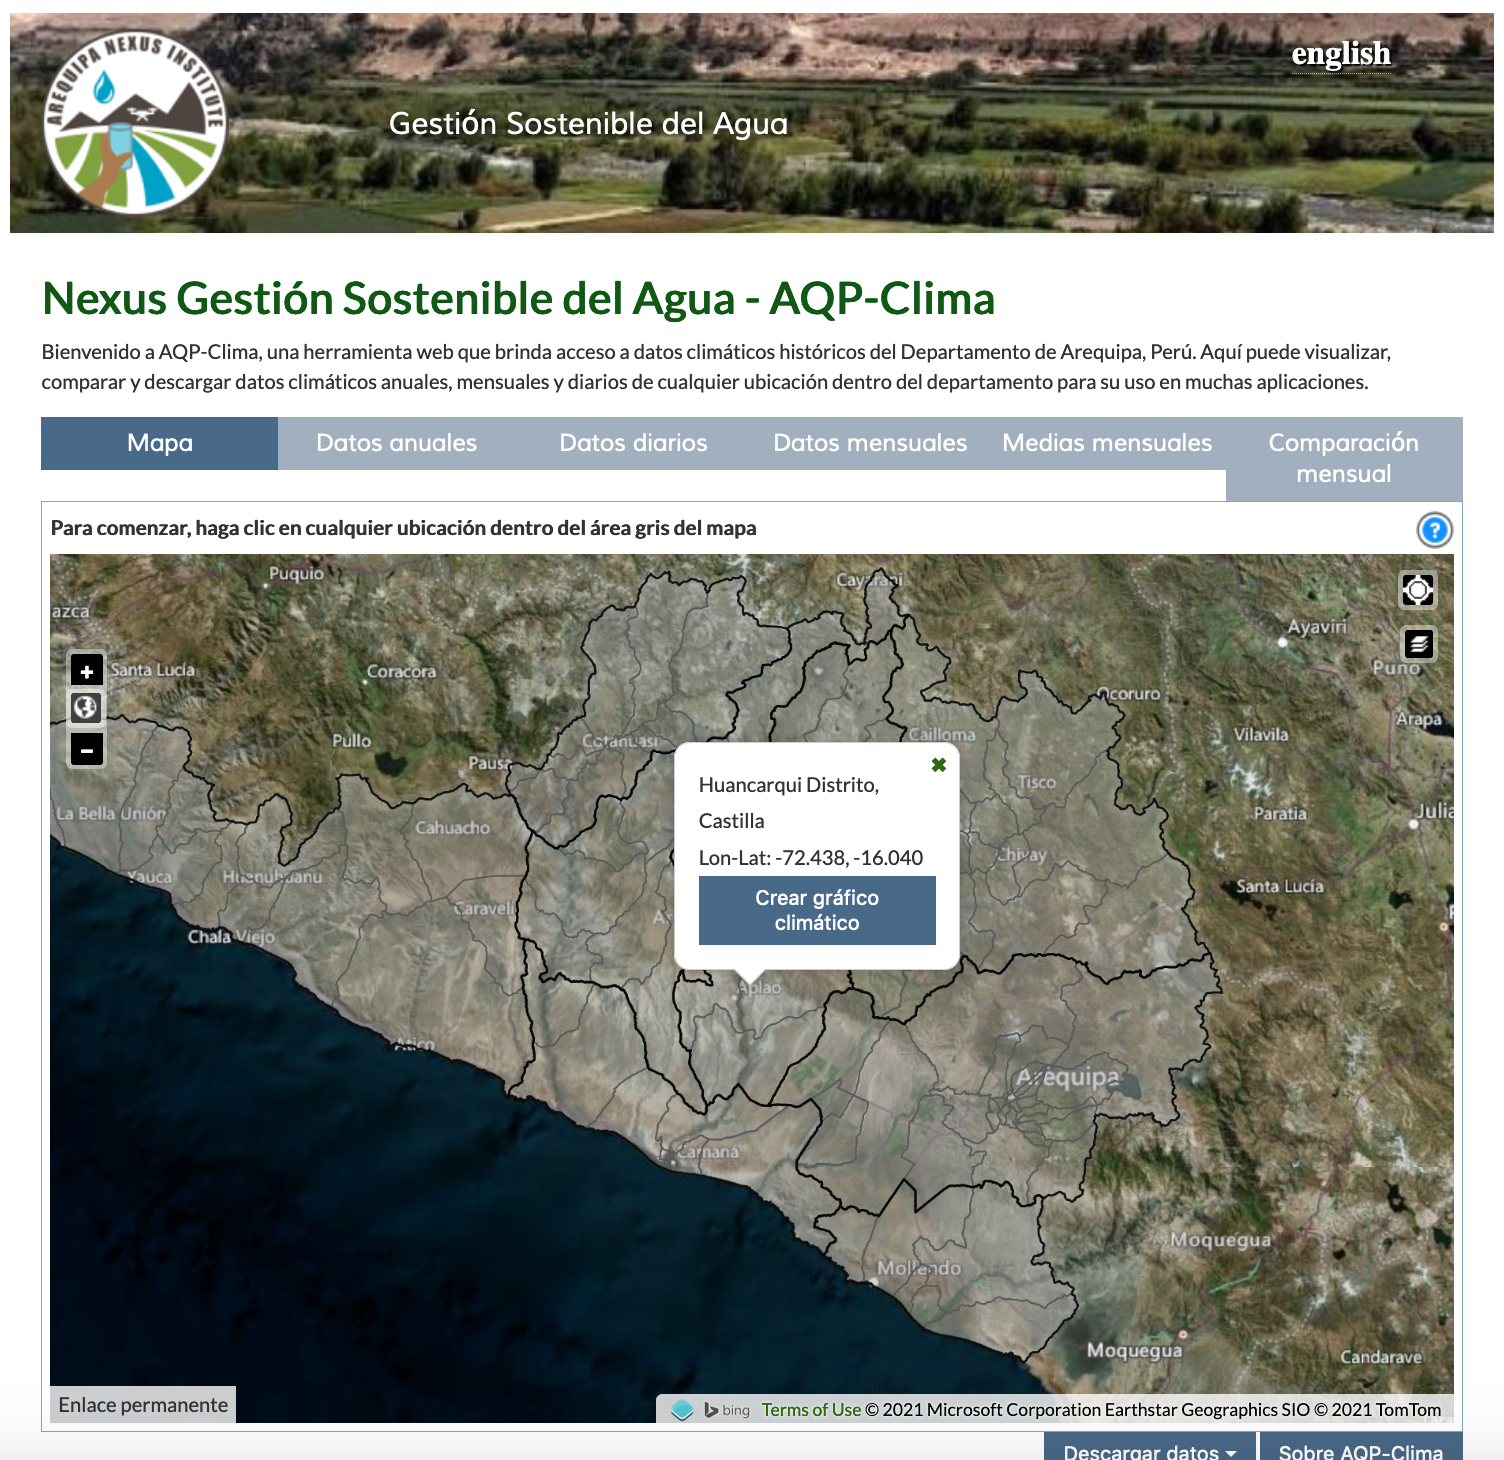
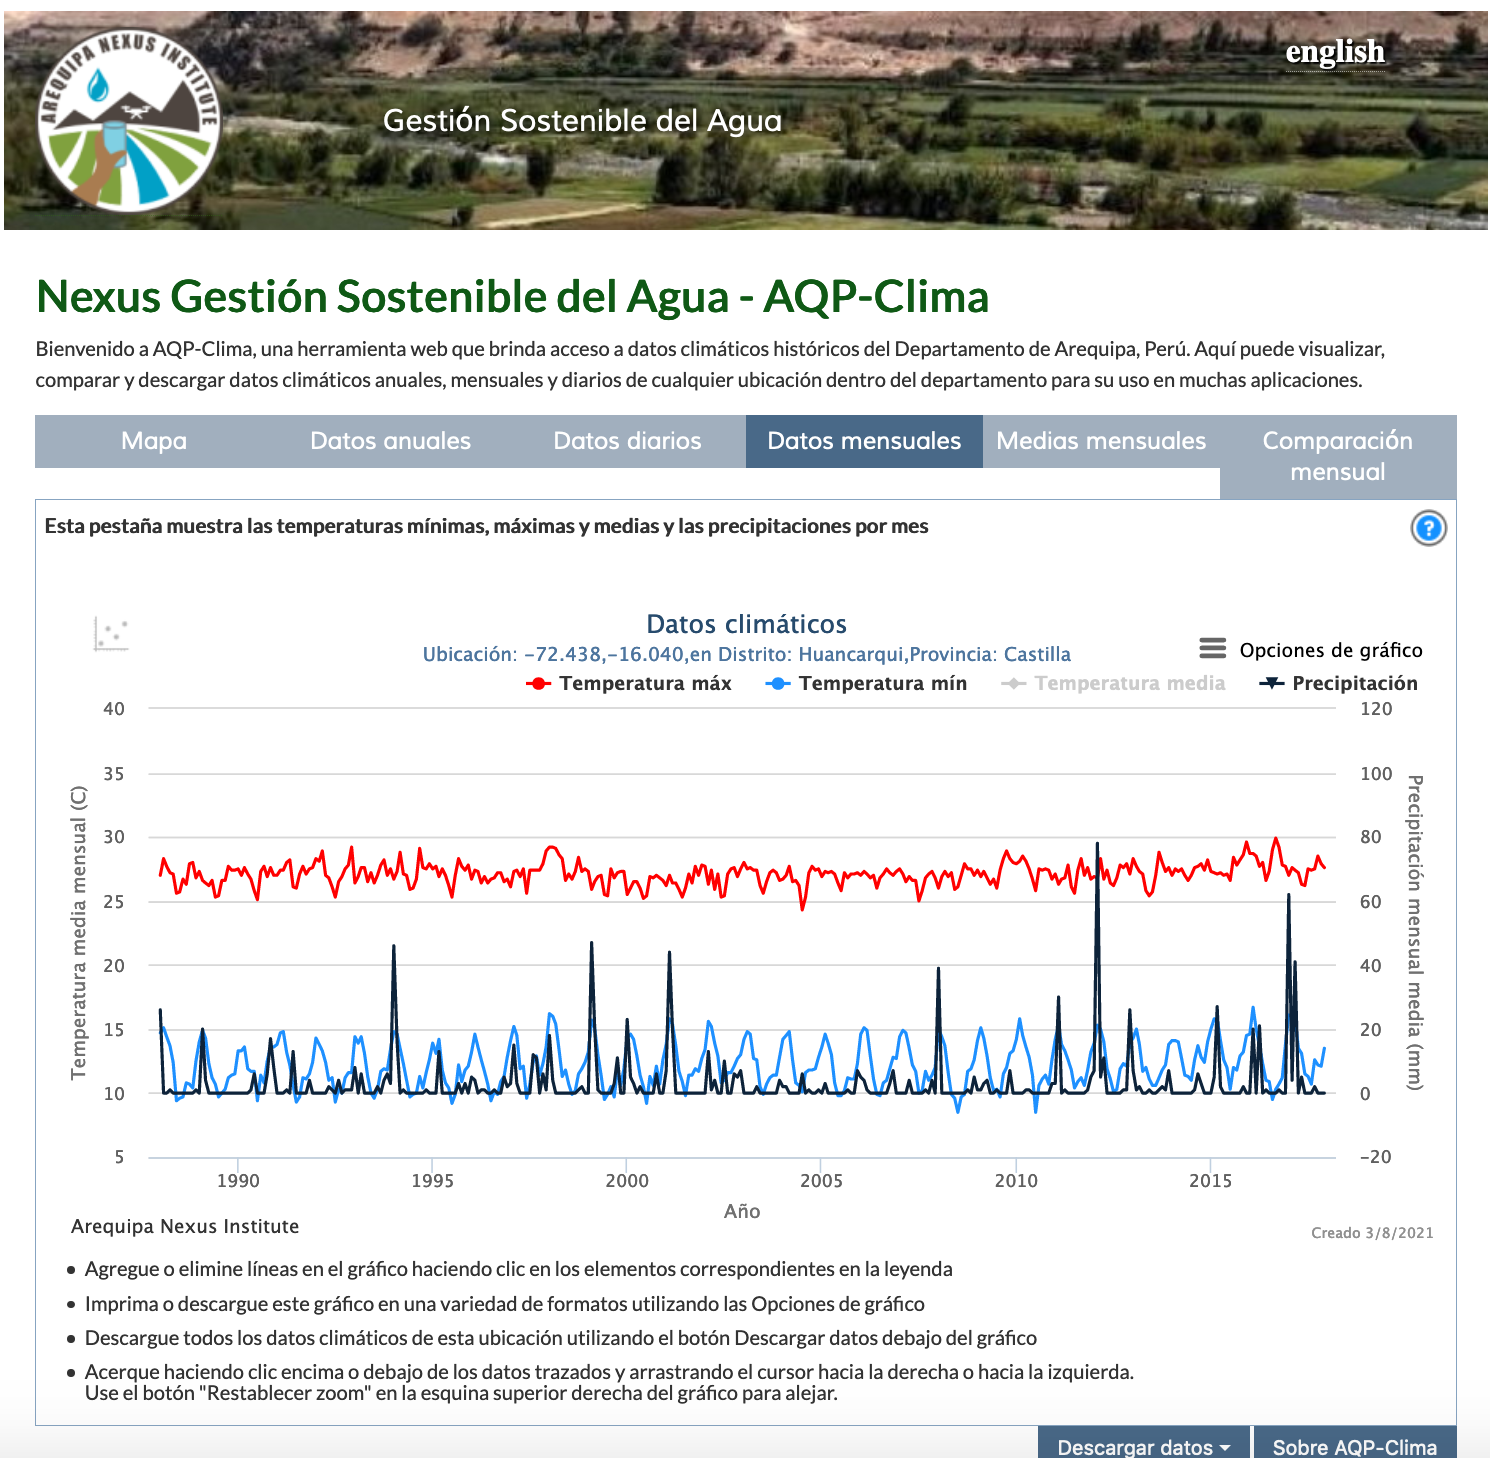
Nexus Gestión Sostenible del Agua - AQP-Clima
This is a web tool that provides access to historical climate data for the Department of Arequipa, Peru. Here you can visualize, compare, and download annual, monthly, and daily climate data for any location within the department for use in many applications.
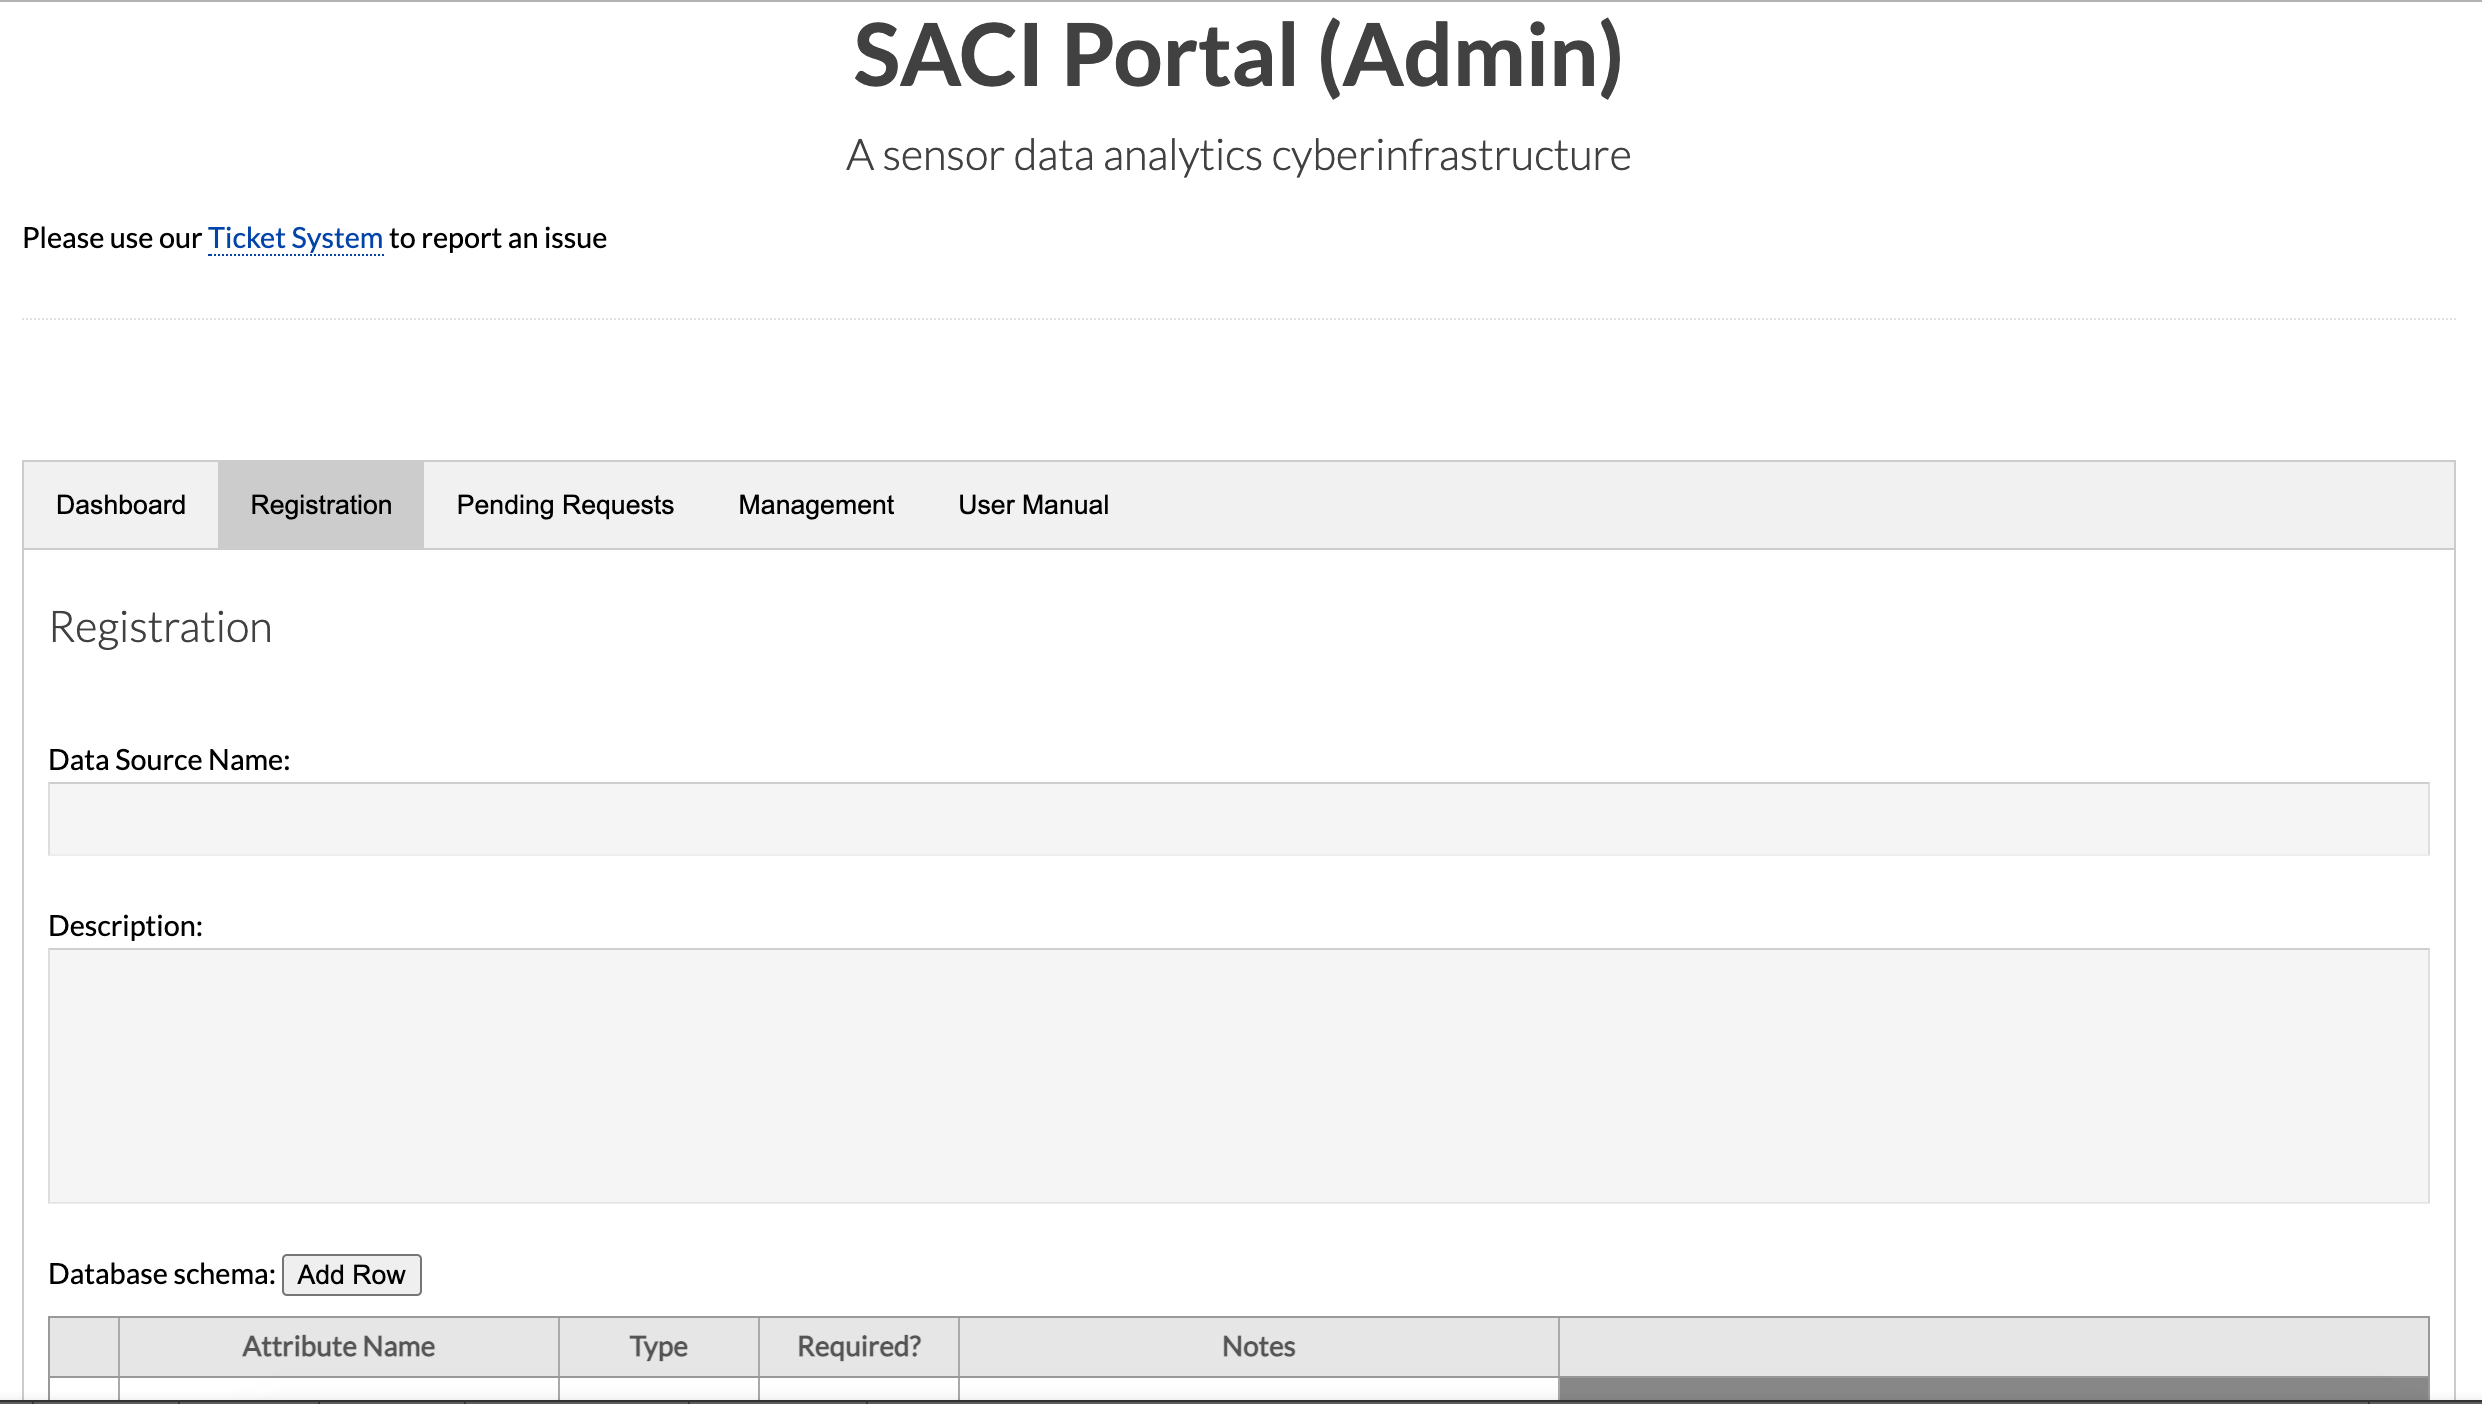
StreamCI: Sensor Data Cyberinfrastructure Platform
StreamCI (formerly named SACI) is a scalable and flexible sensor data collection and analysis platform. It allows sensor data researchers to easily collect, process, store, and access large volumes of heterogeneous sensor data collected in the field. It supports real-time data ingestion and processing pipelines using an open source software stack including RabbitMQ, Docker, Node.js, MongoDB, and HUBzero. More information about StreamCI can be found here.
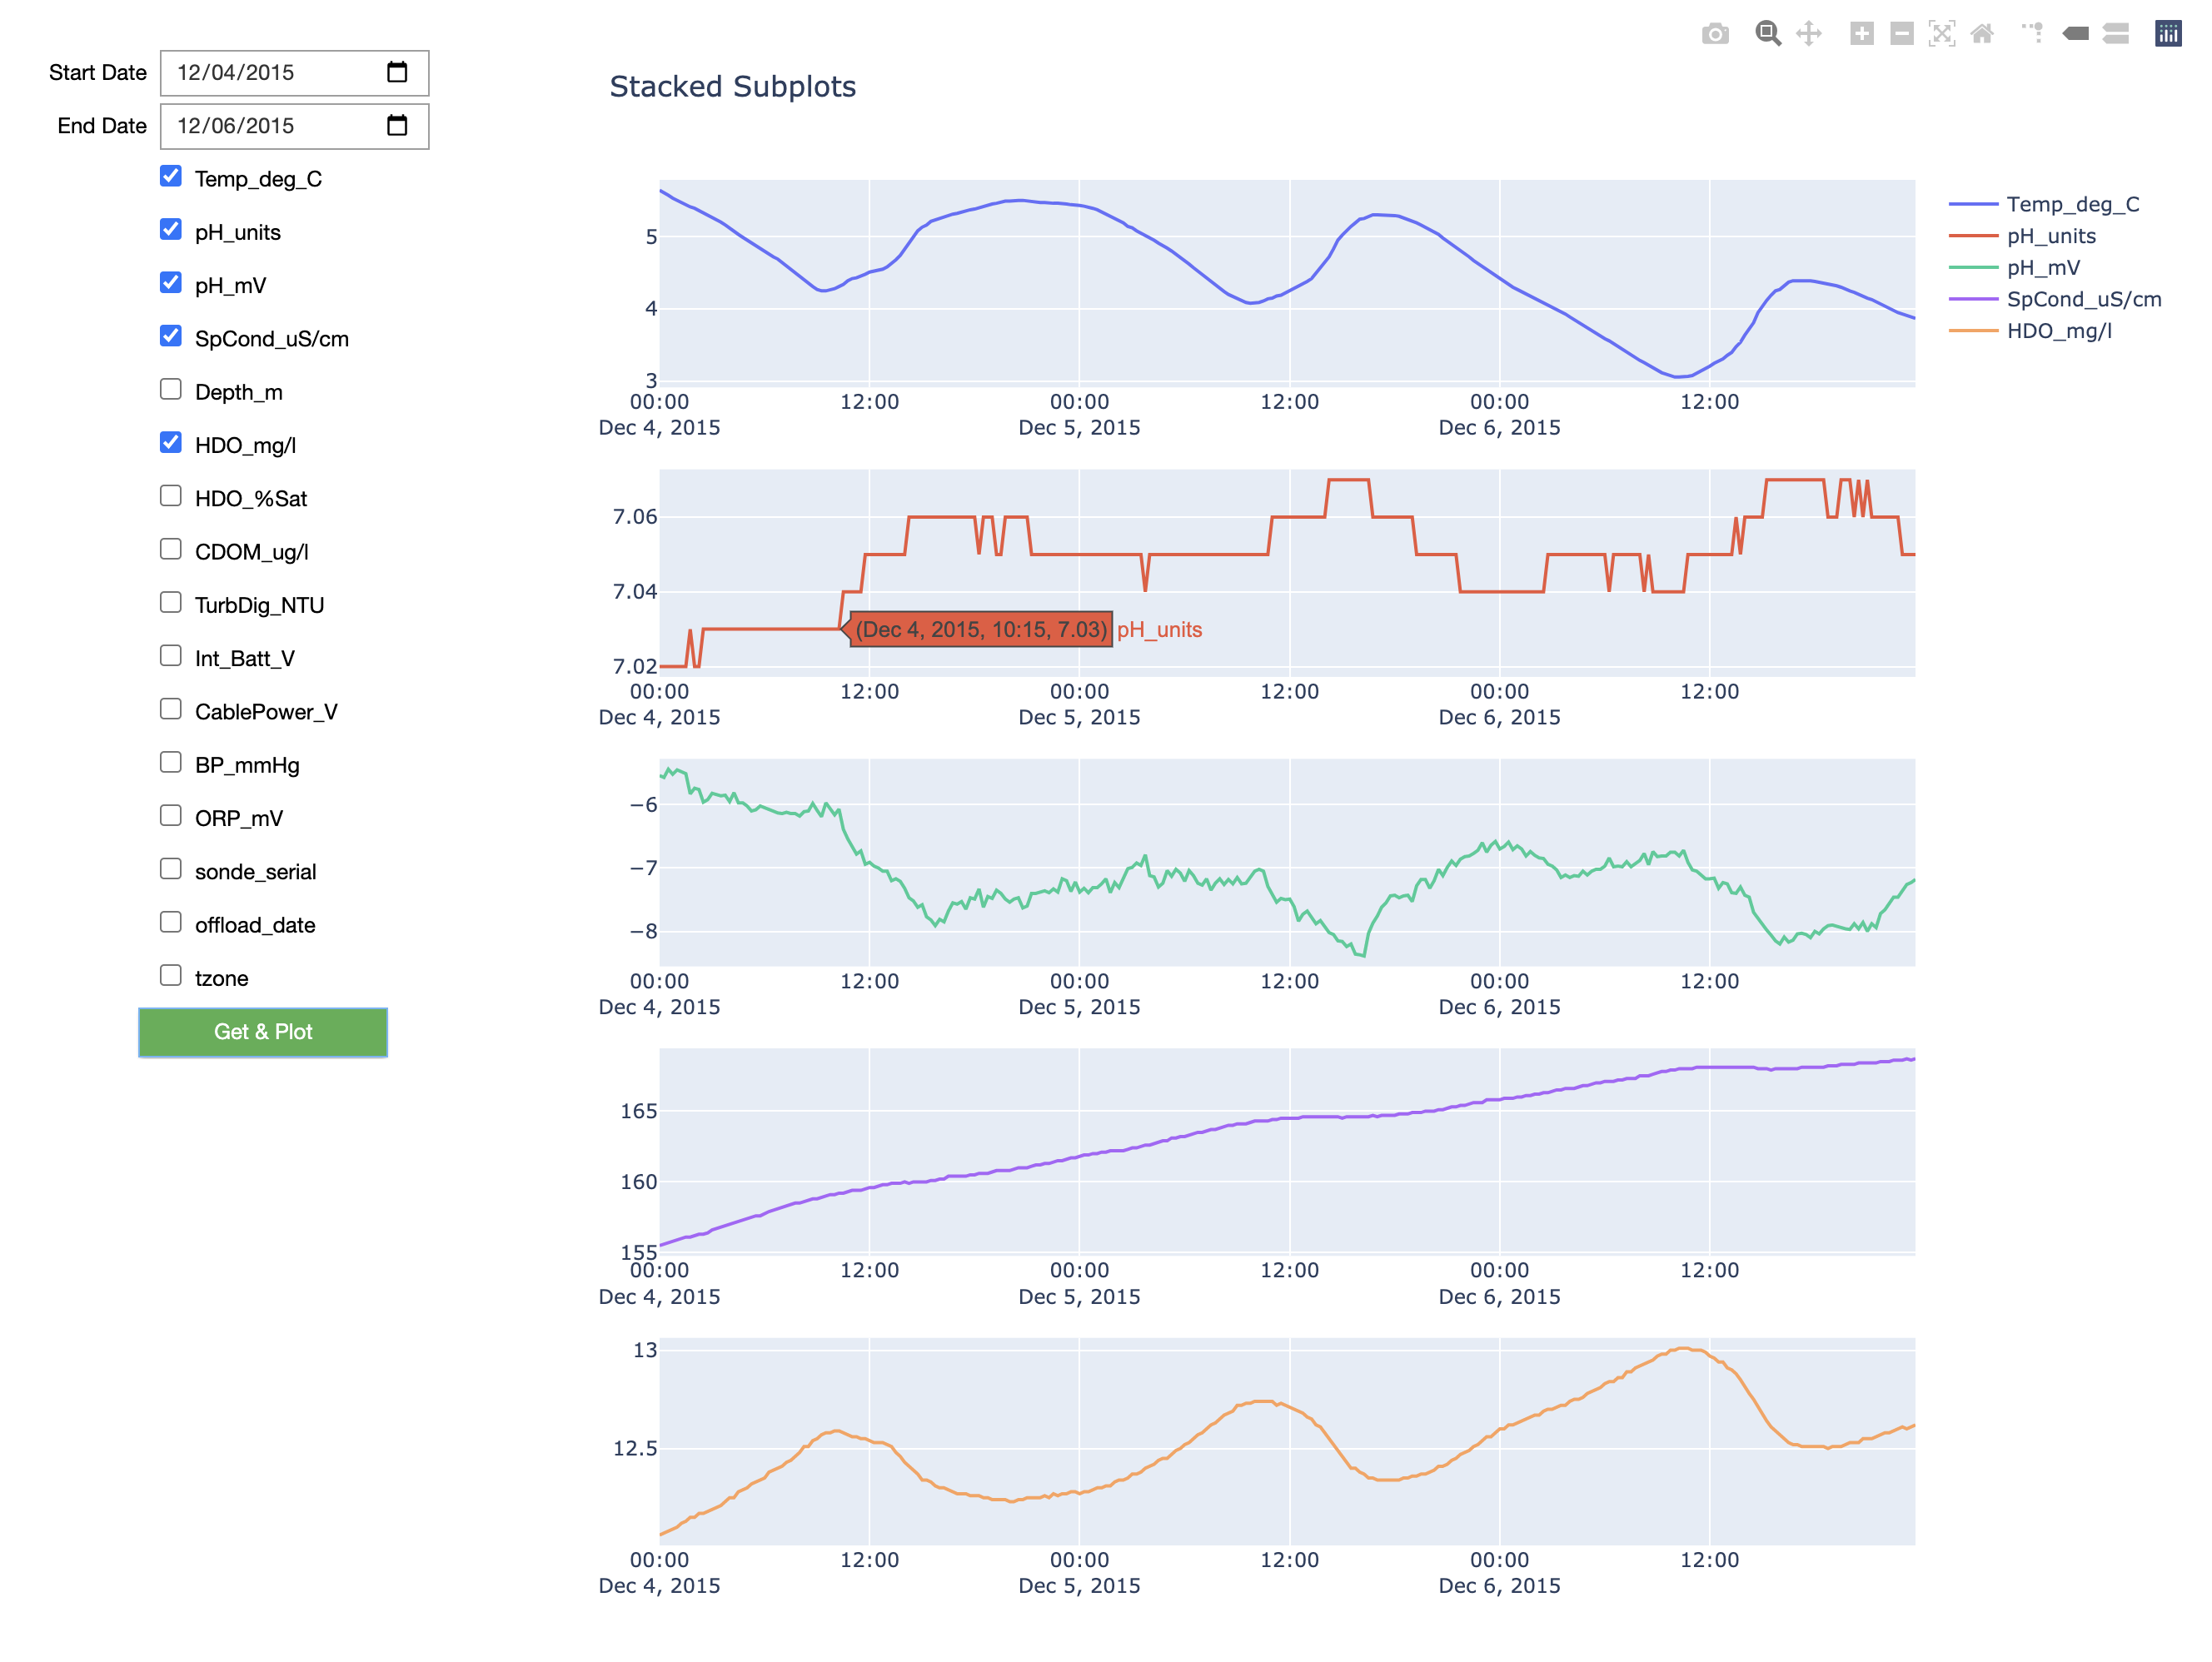
Introduction Video
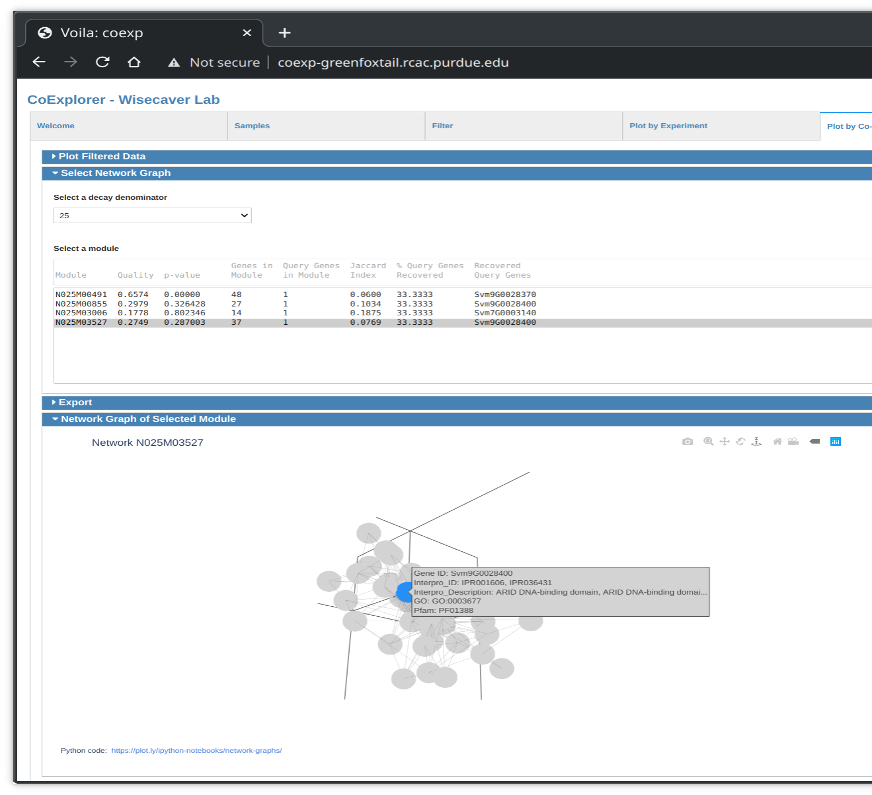
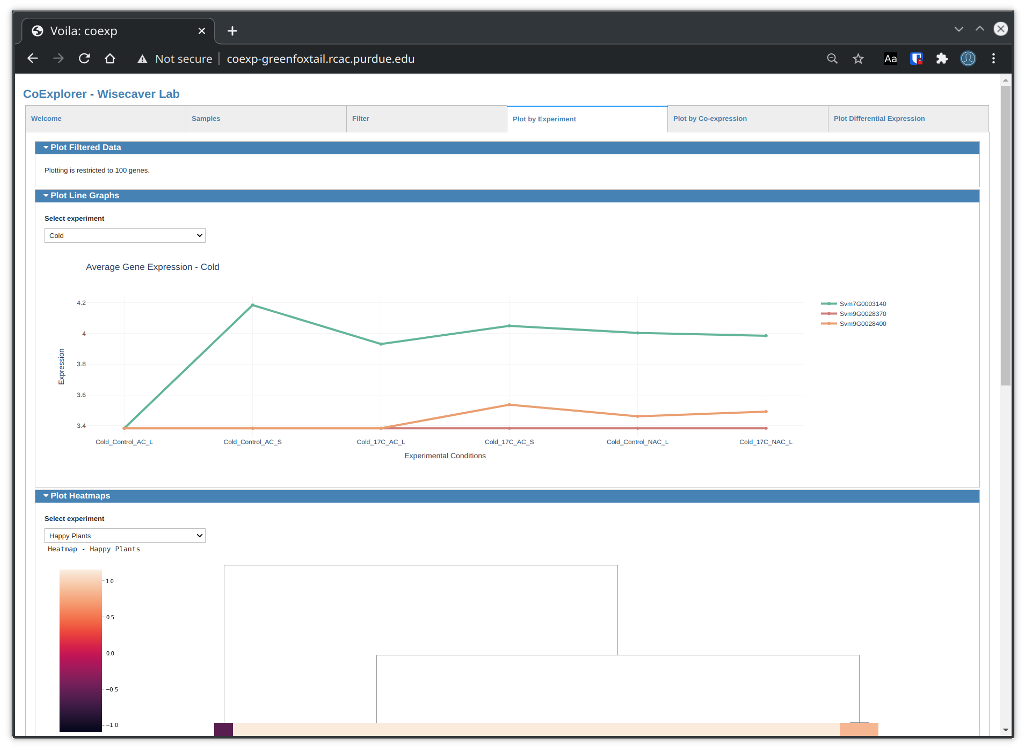
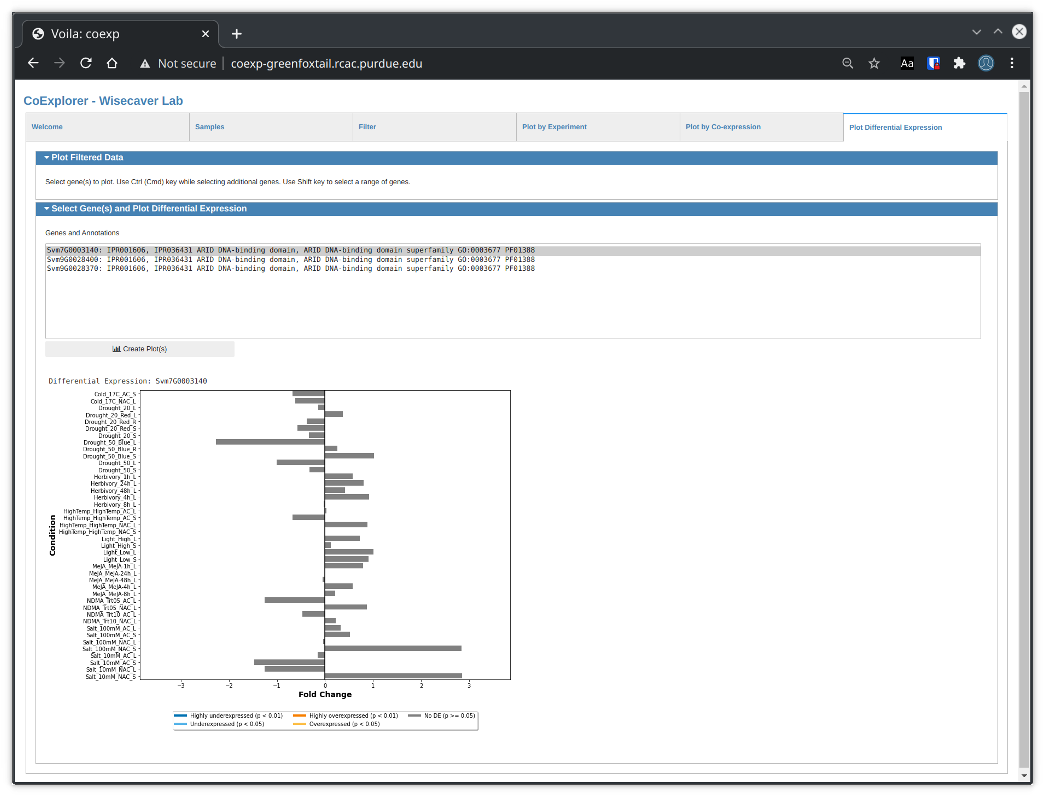
CoExplorer
An interactive tool for analysis, visualization, and selective downloads of gene coexpression network data used by genomics researchers.
Technology: Jupyter Notebook, Voila, Docker, ipywidgets, Matplotlib, Plotly
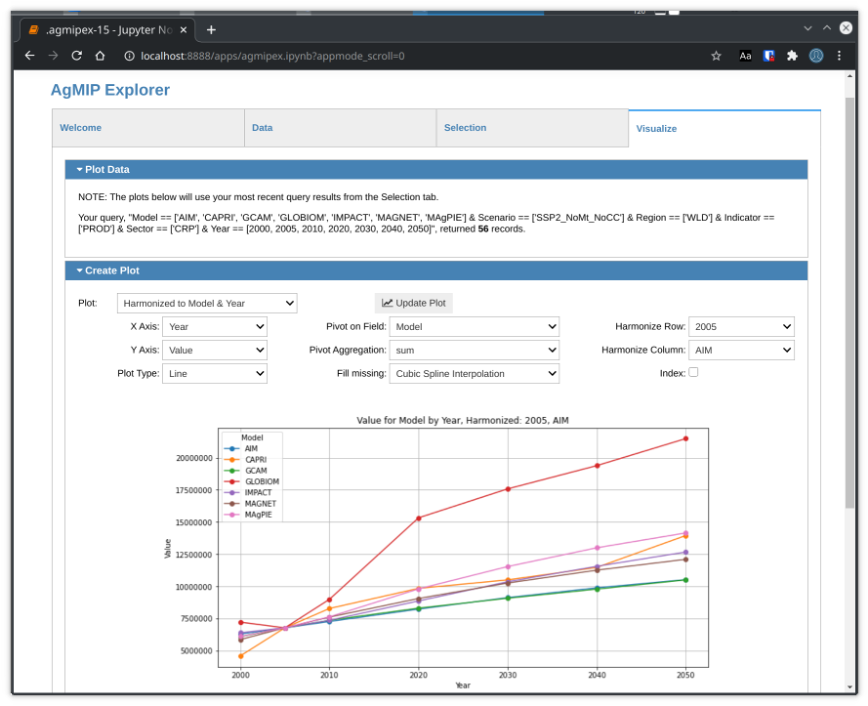
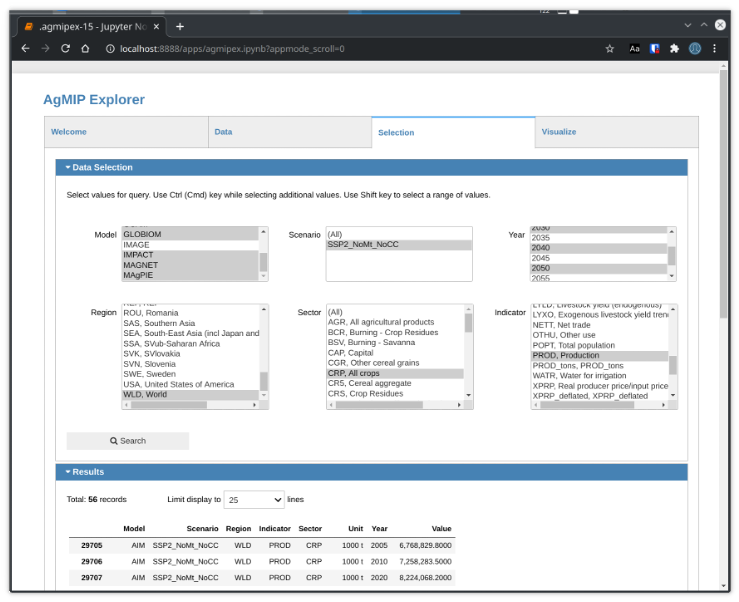
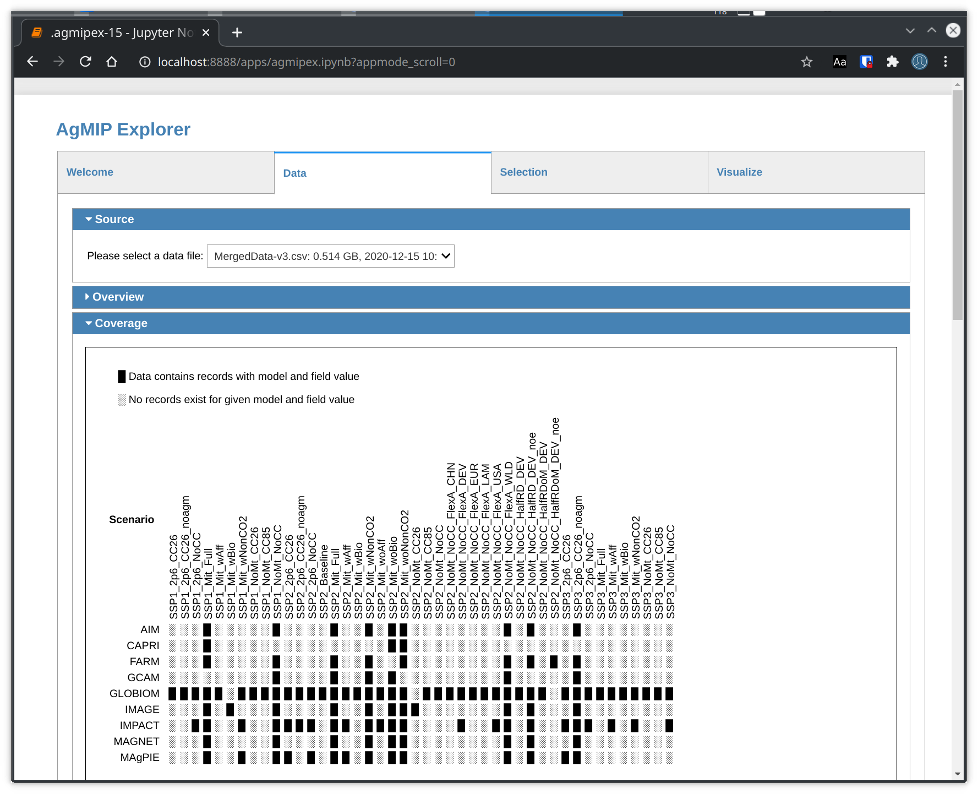
AgMIP Data Explorer
A data exploration and visualization tool for the Agricultural Model Intercomparison and Improvement Project.
Technology: Jupyter Notebook, HUBzero, ipywidgets, pandas - Python Data Analysis Library
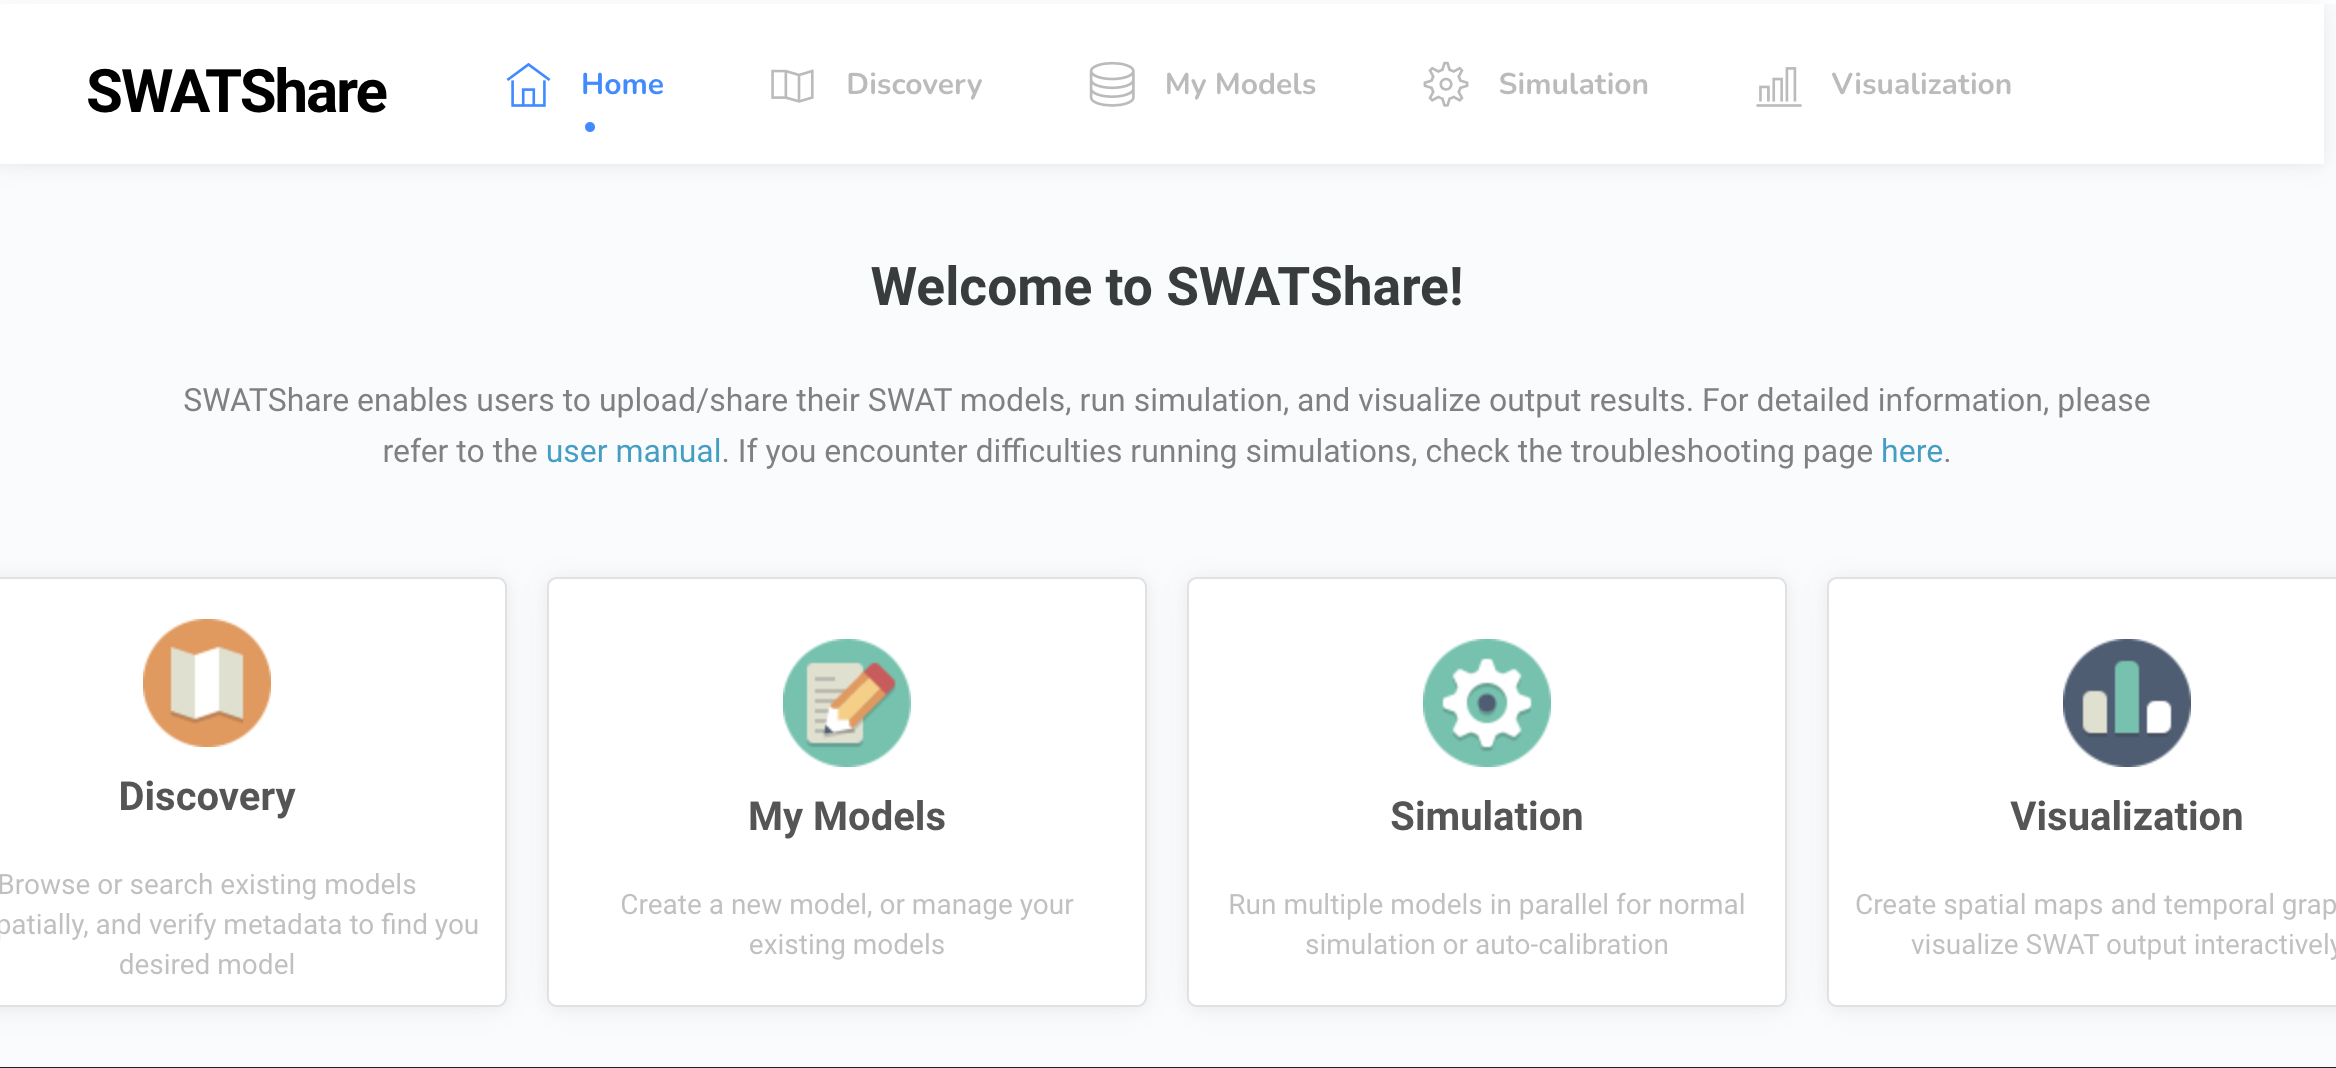
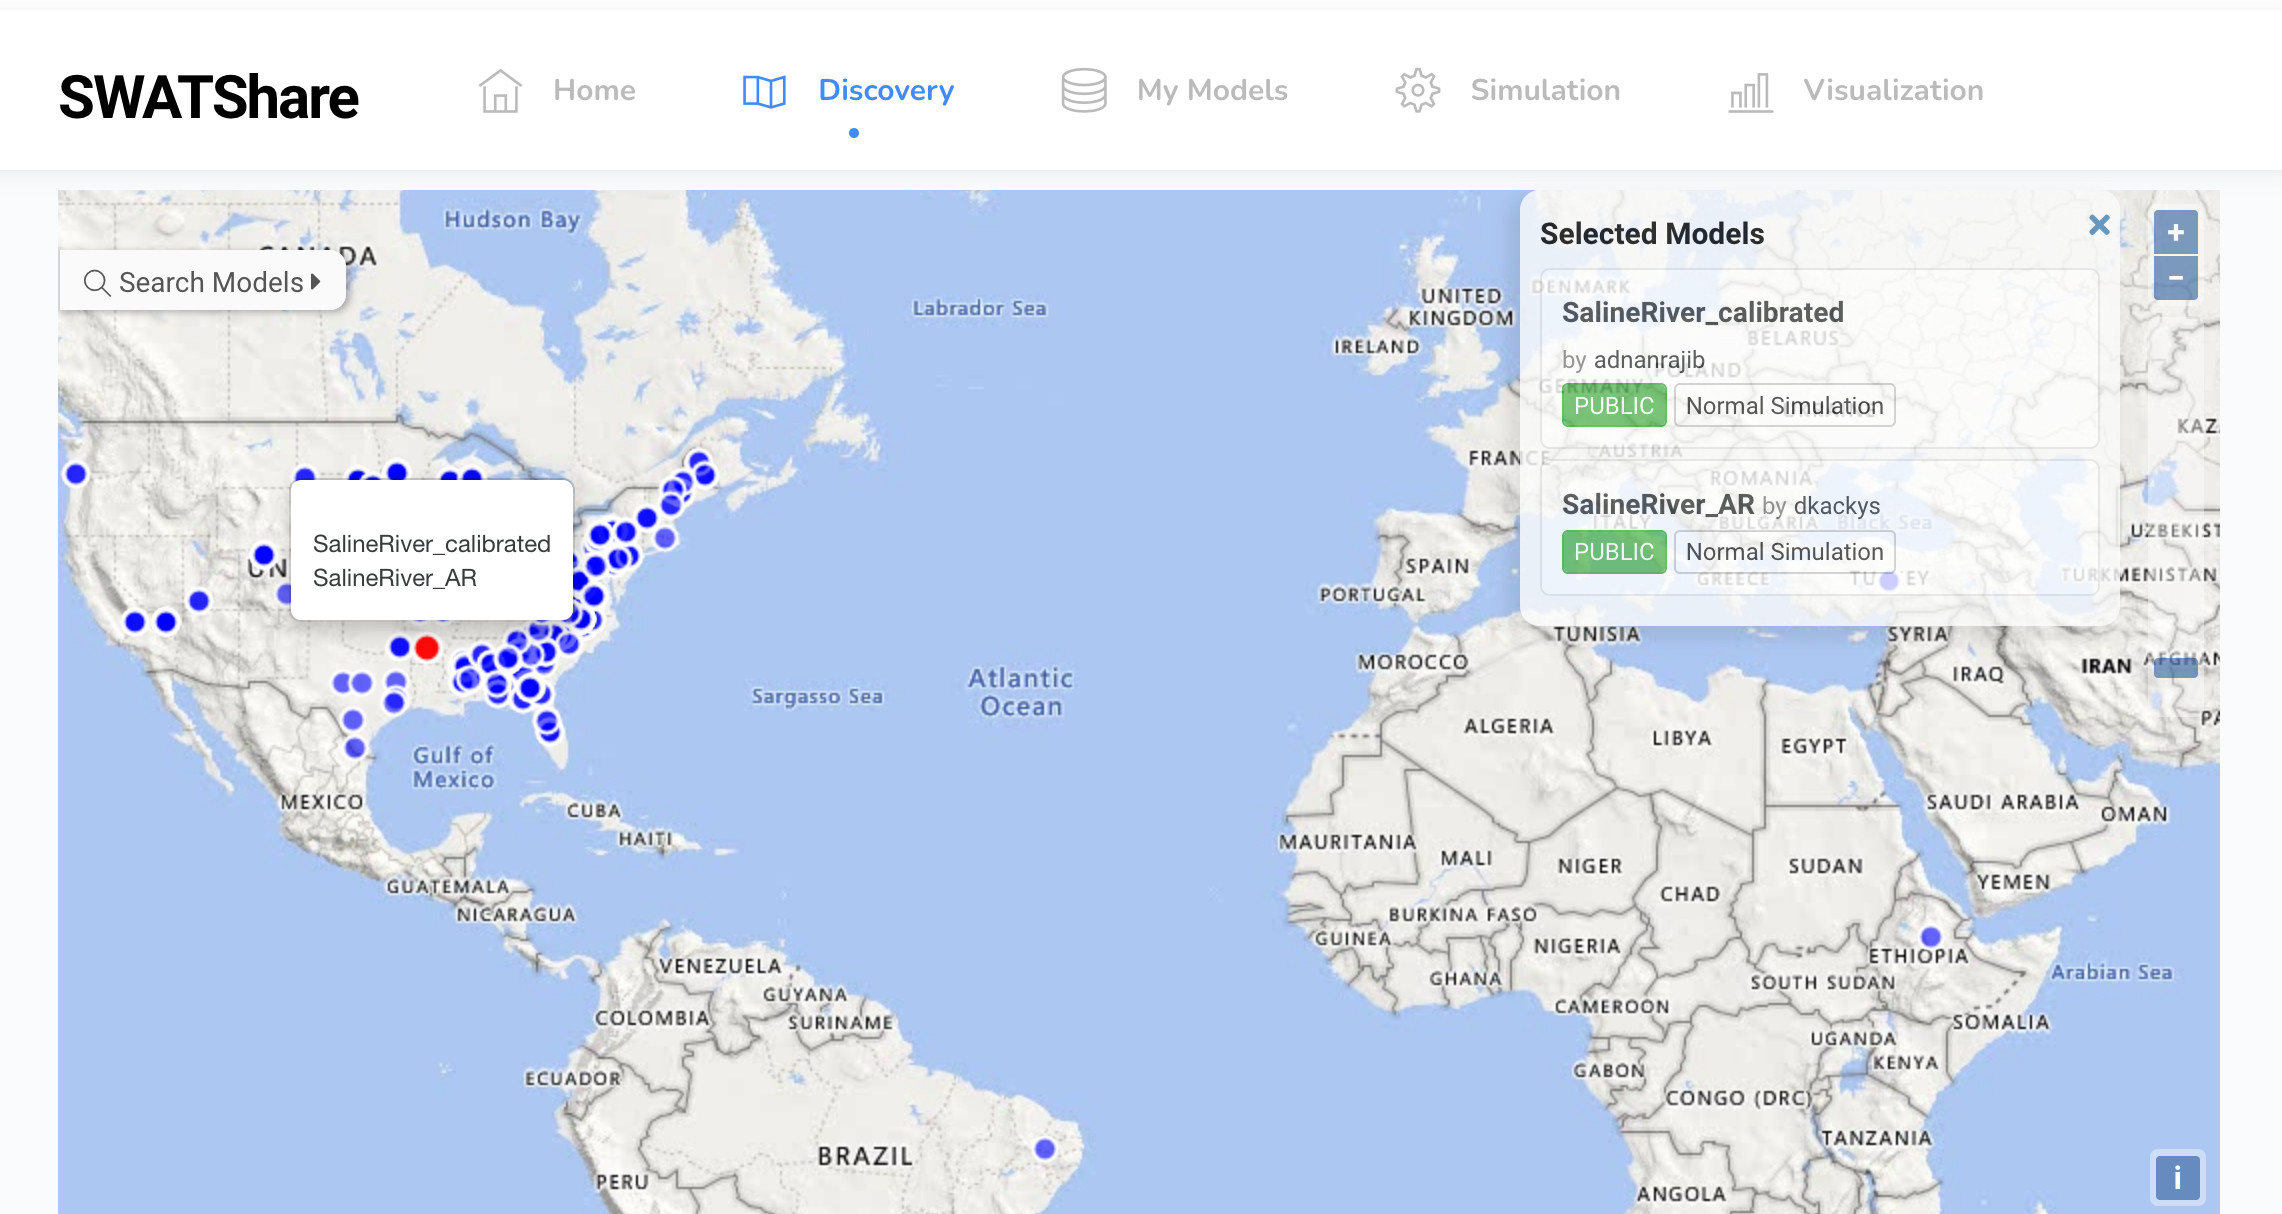
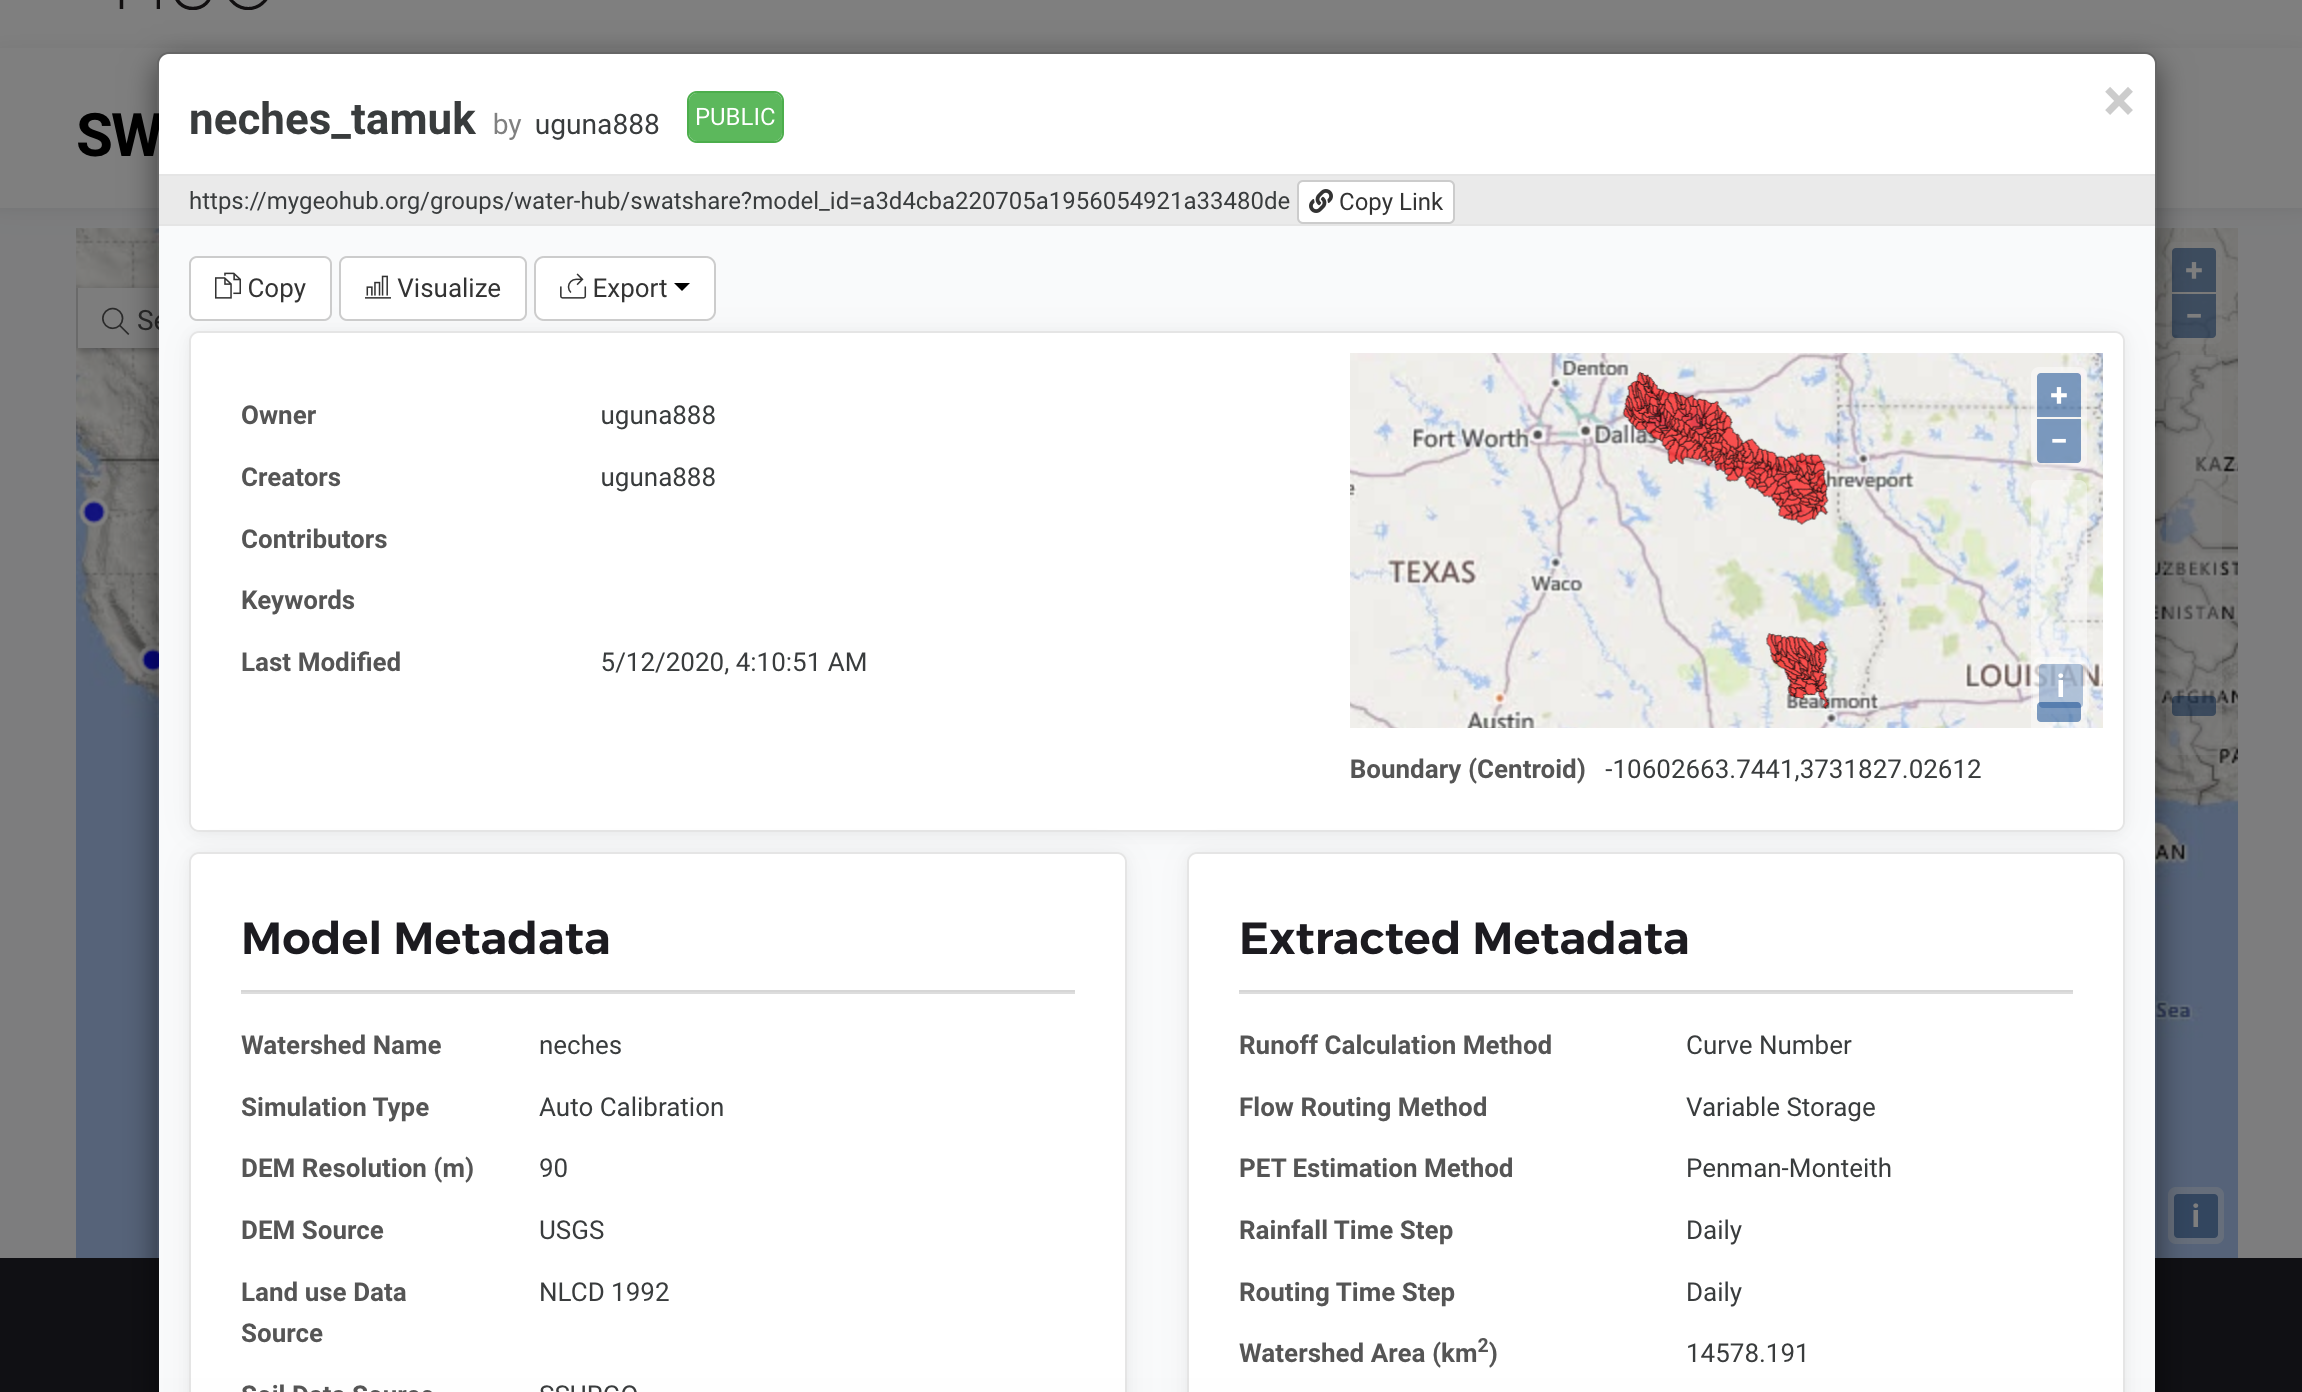
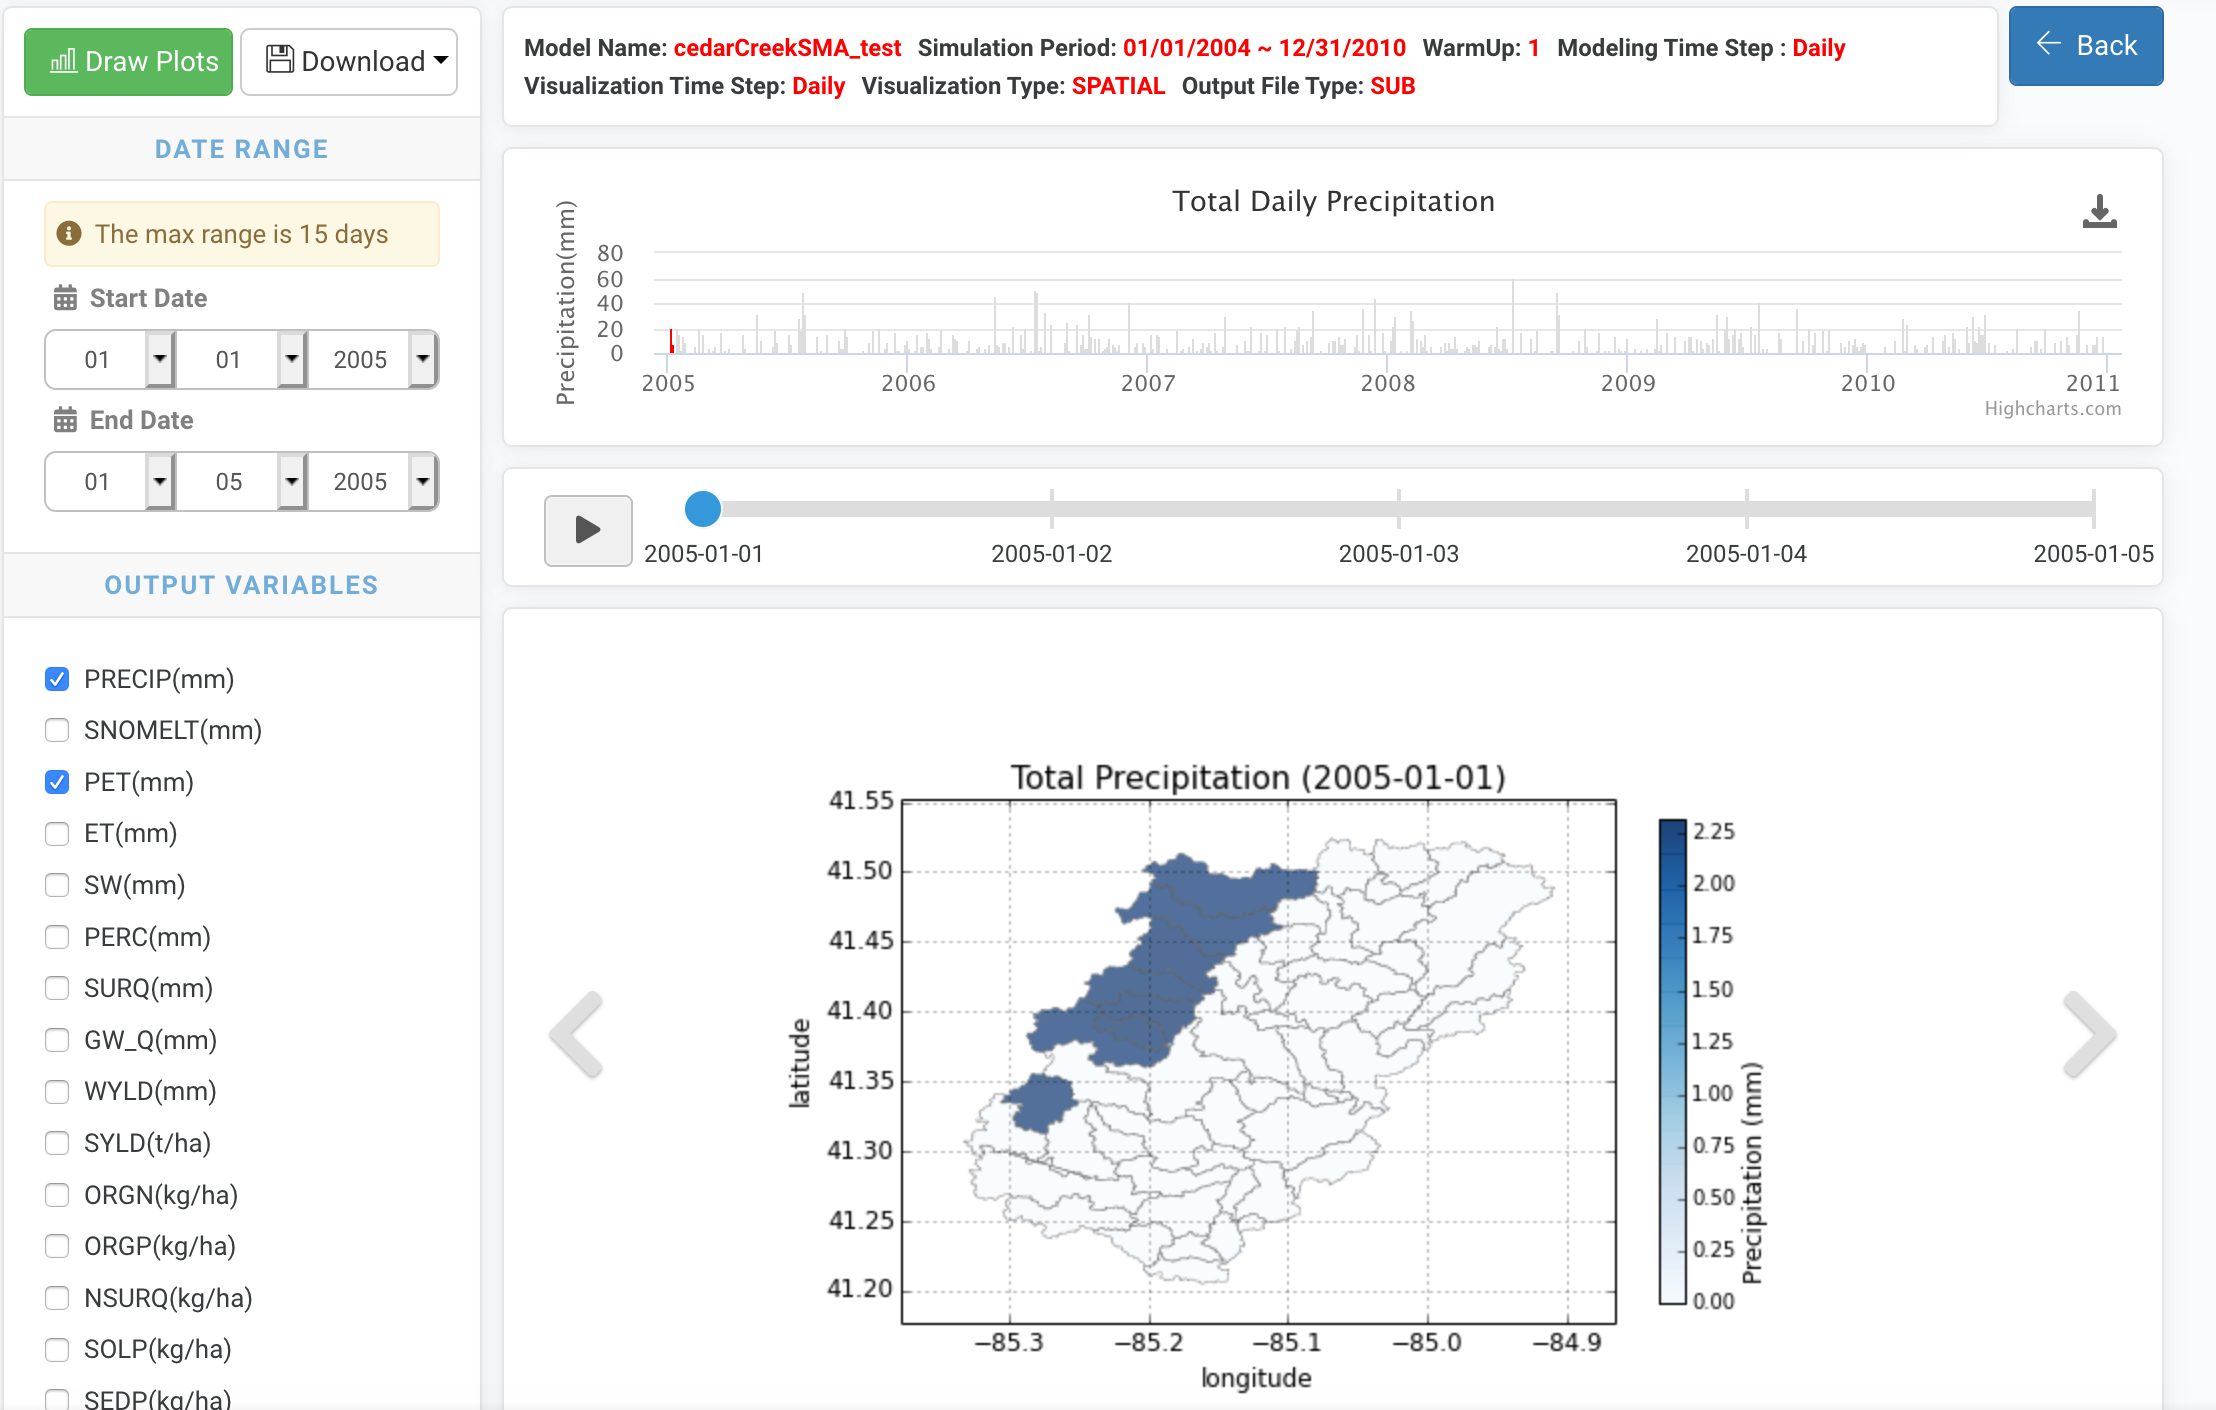
SWATShare: SWAT Simulation and Model Sharing Tool
An online Environment for online sharing, simulation, and visualization of SWAT models.
Technology: JavaScript, Highchart, OpenLayer, BootStrap 3
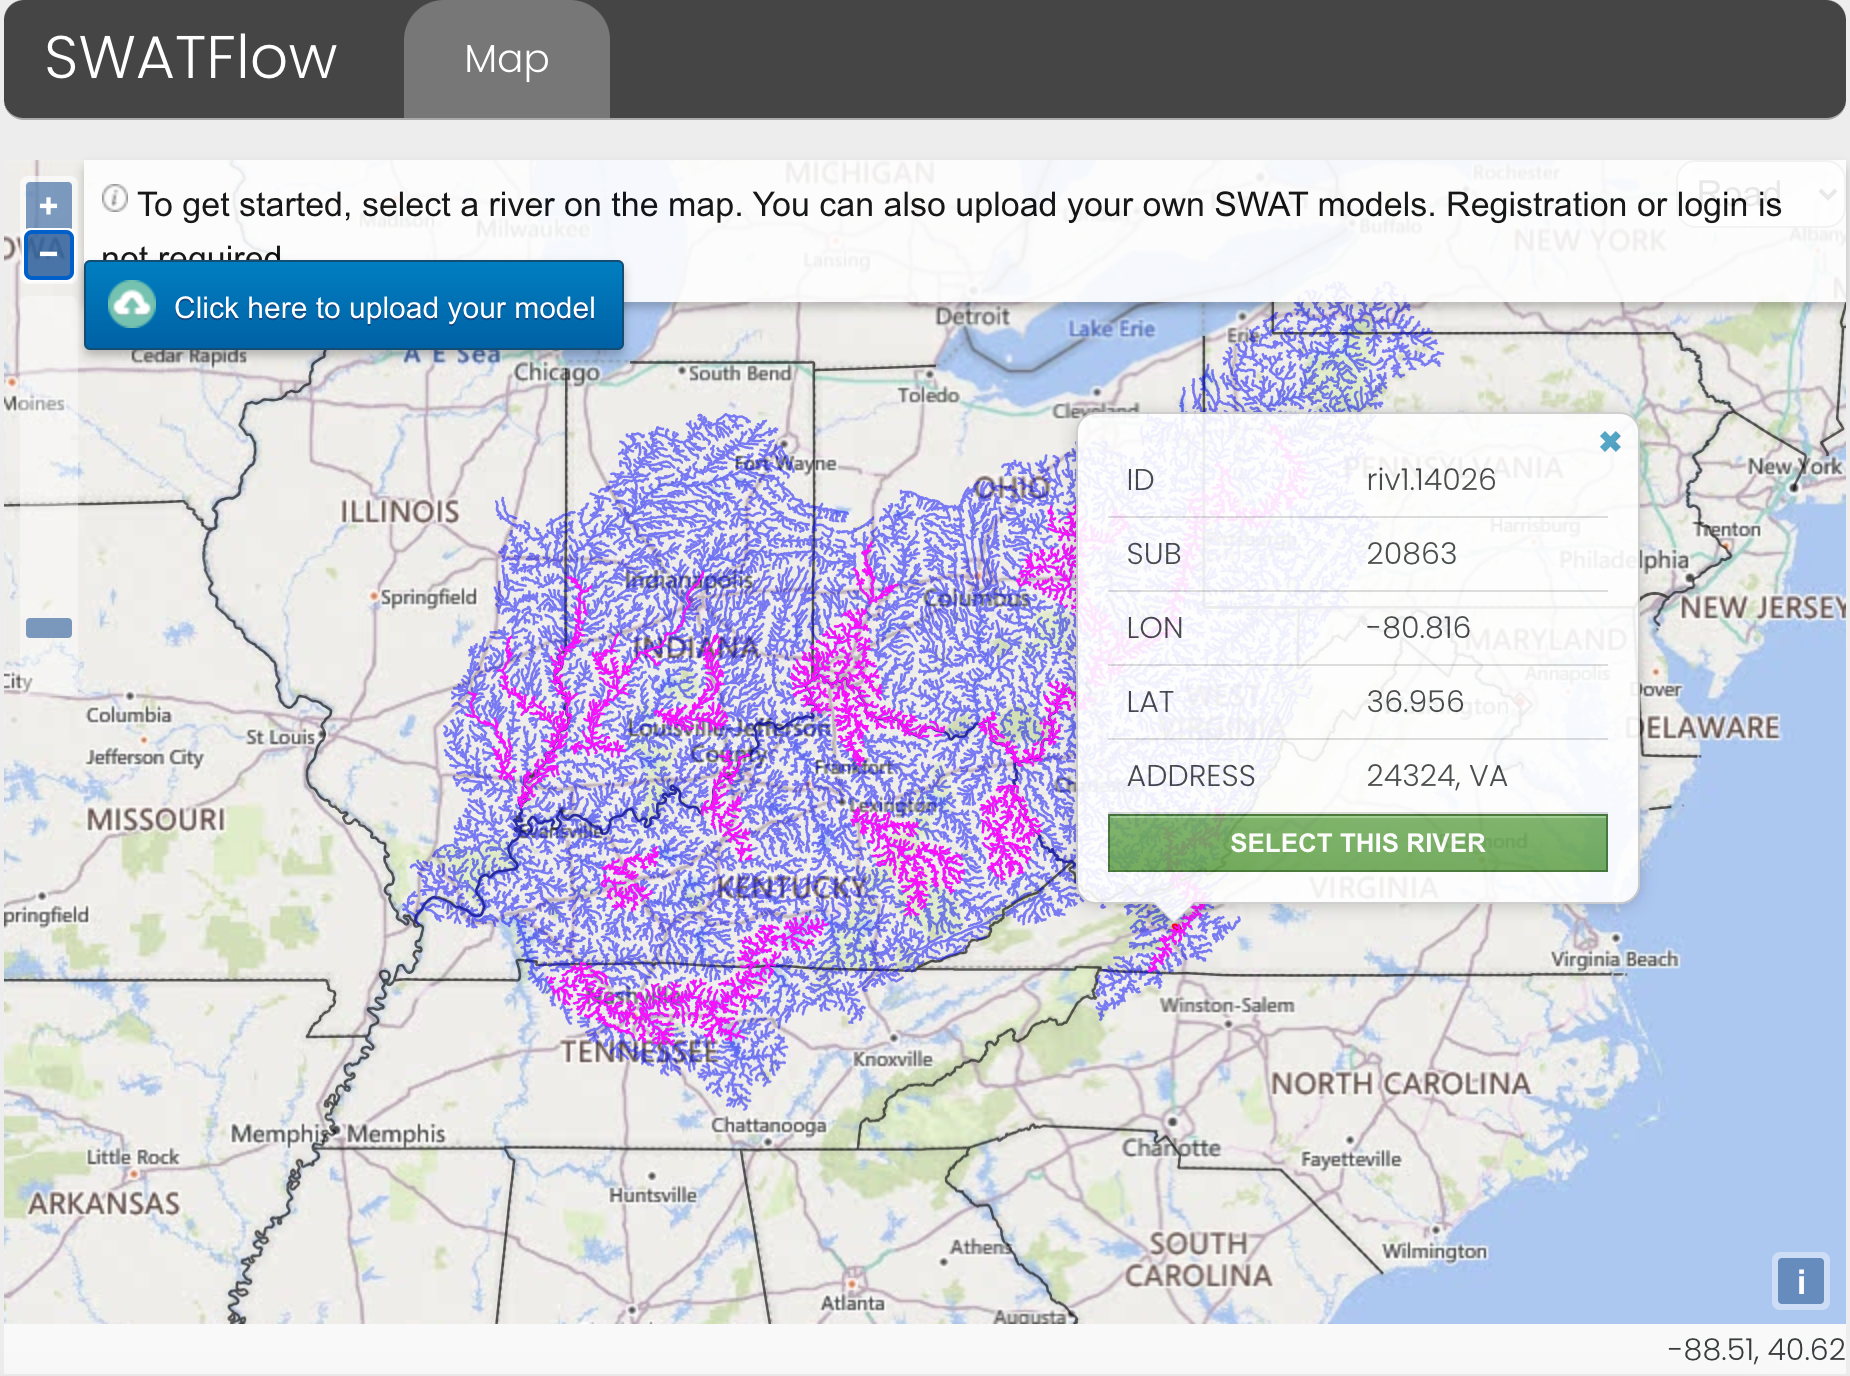
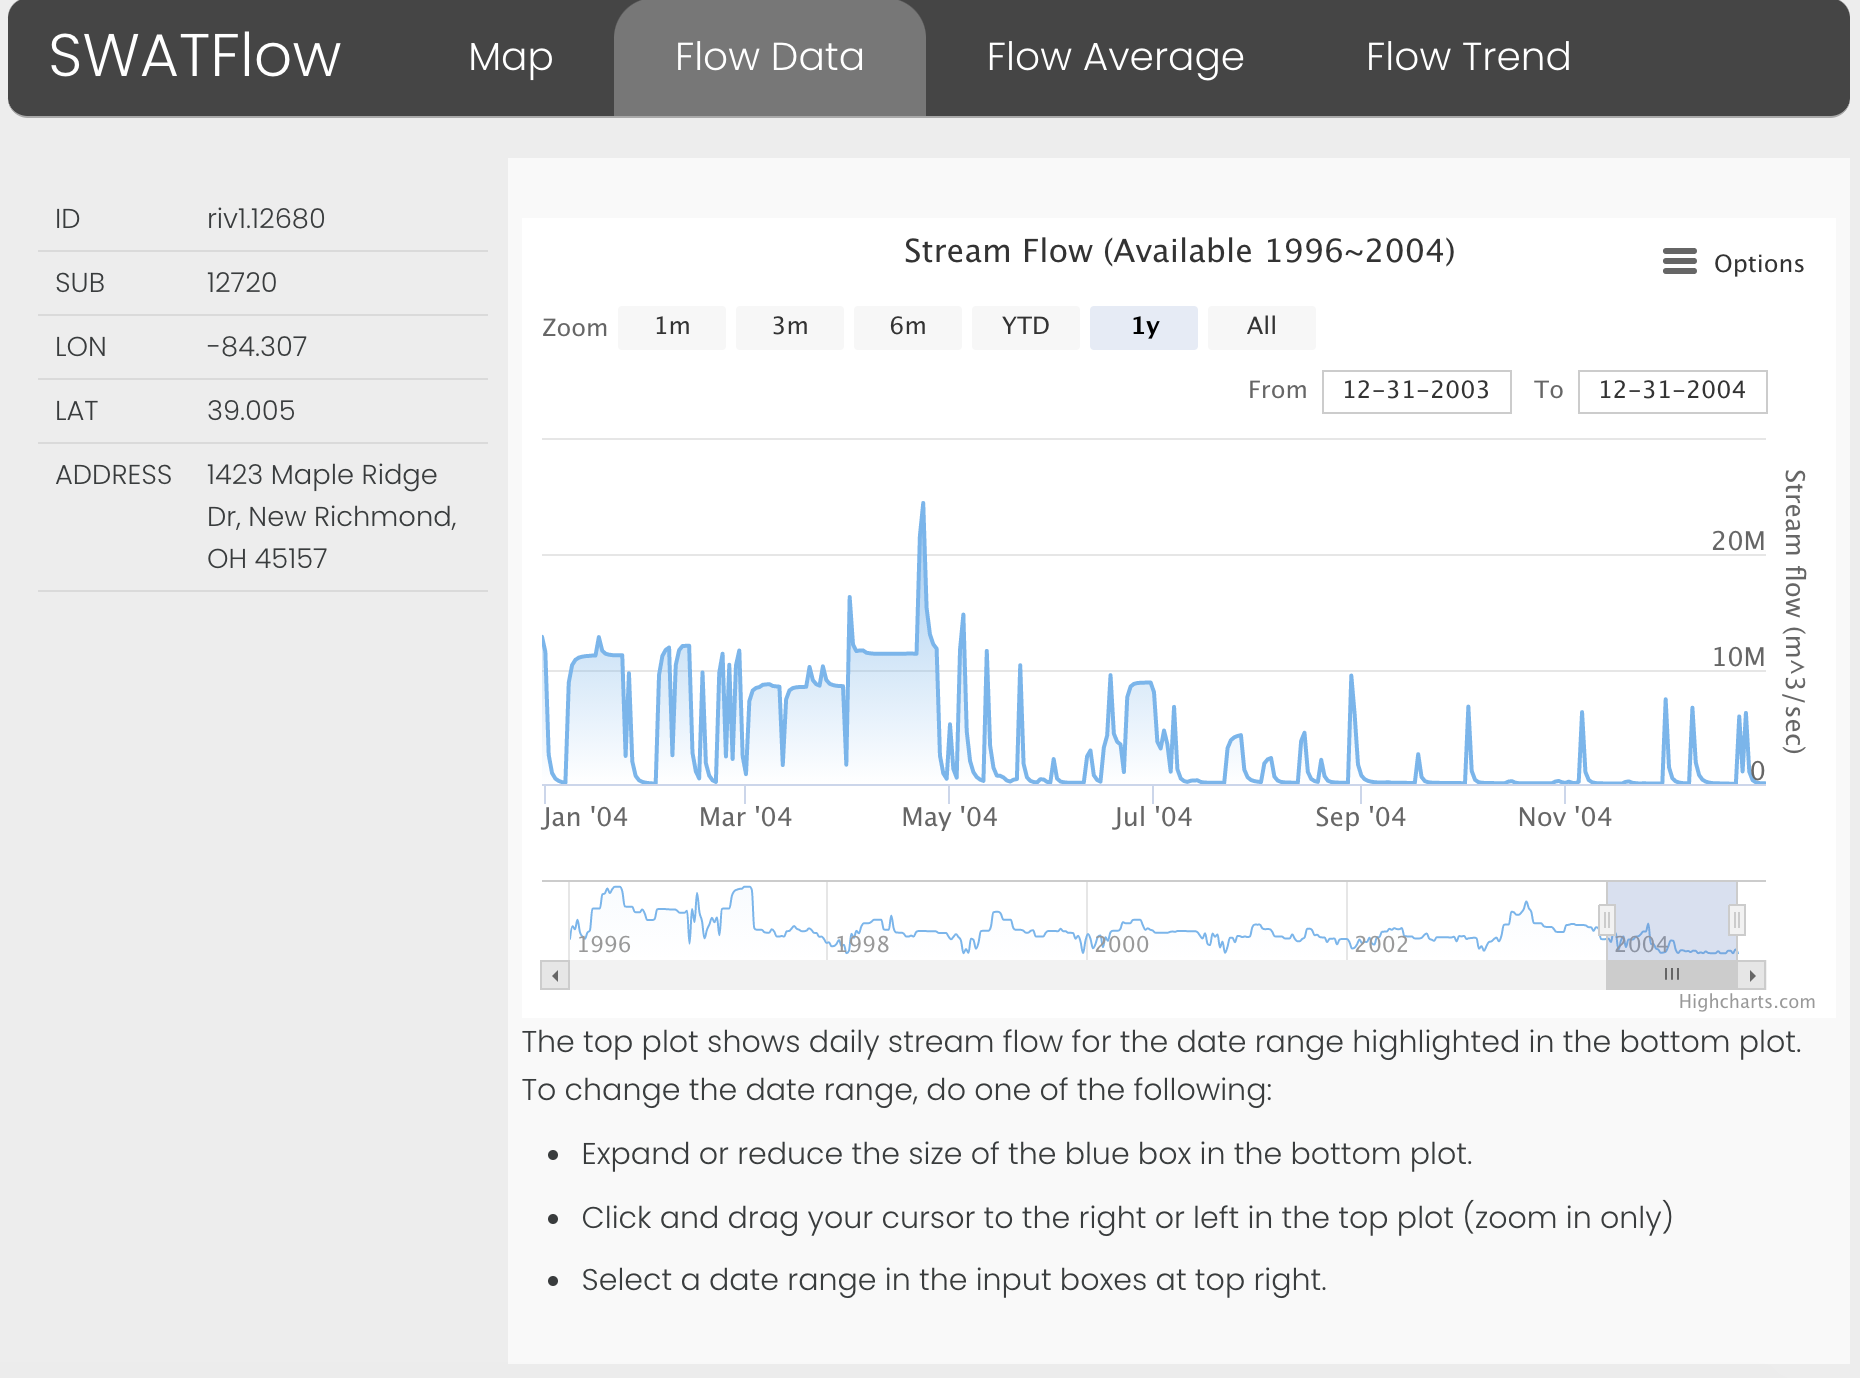
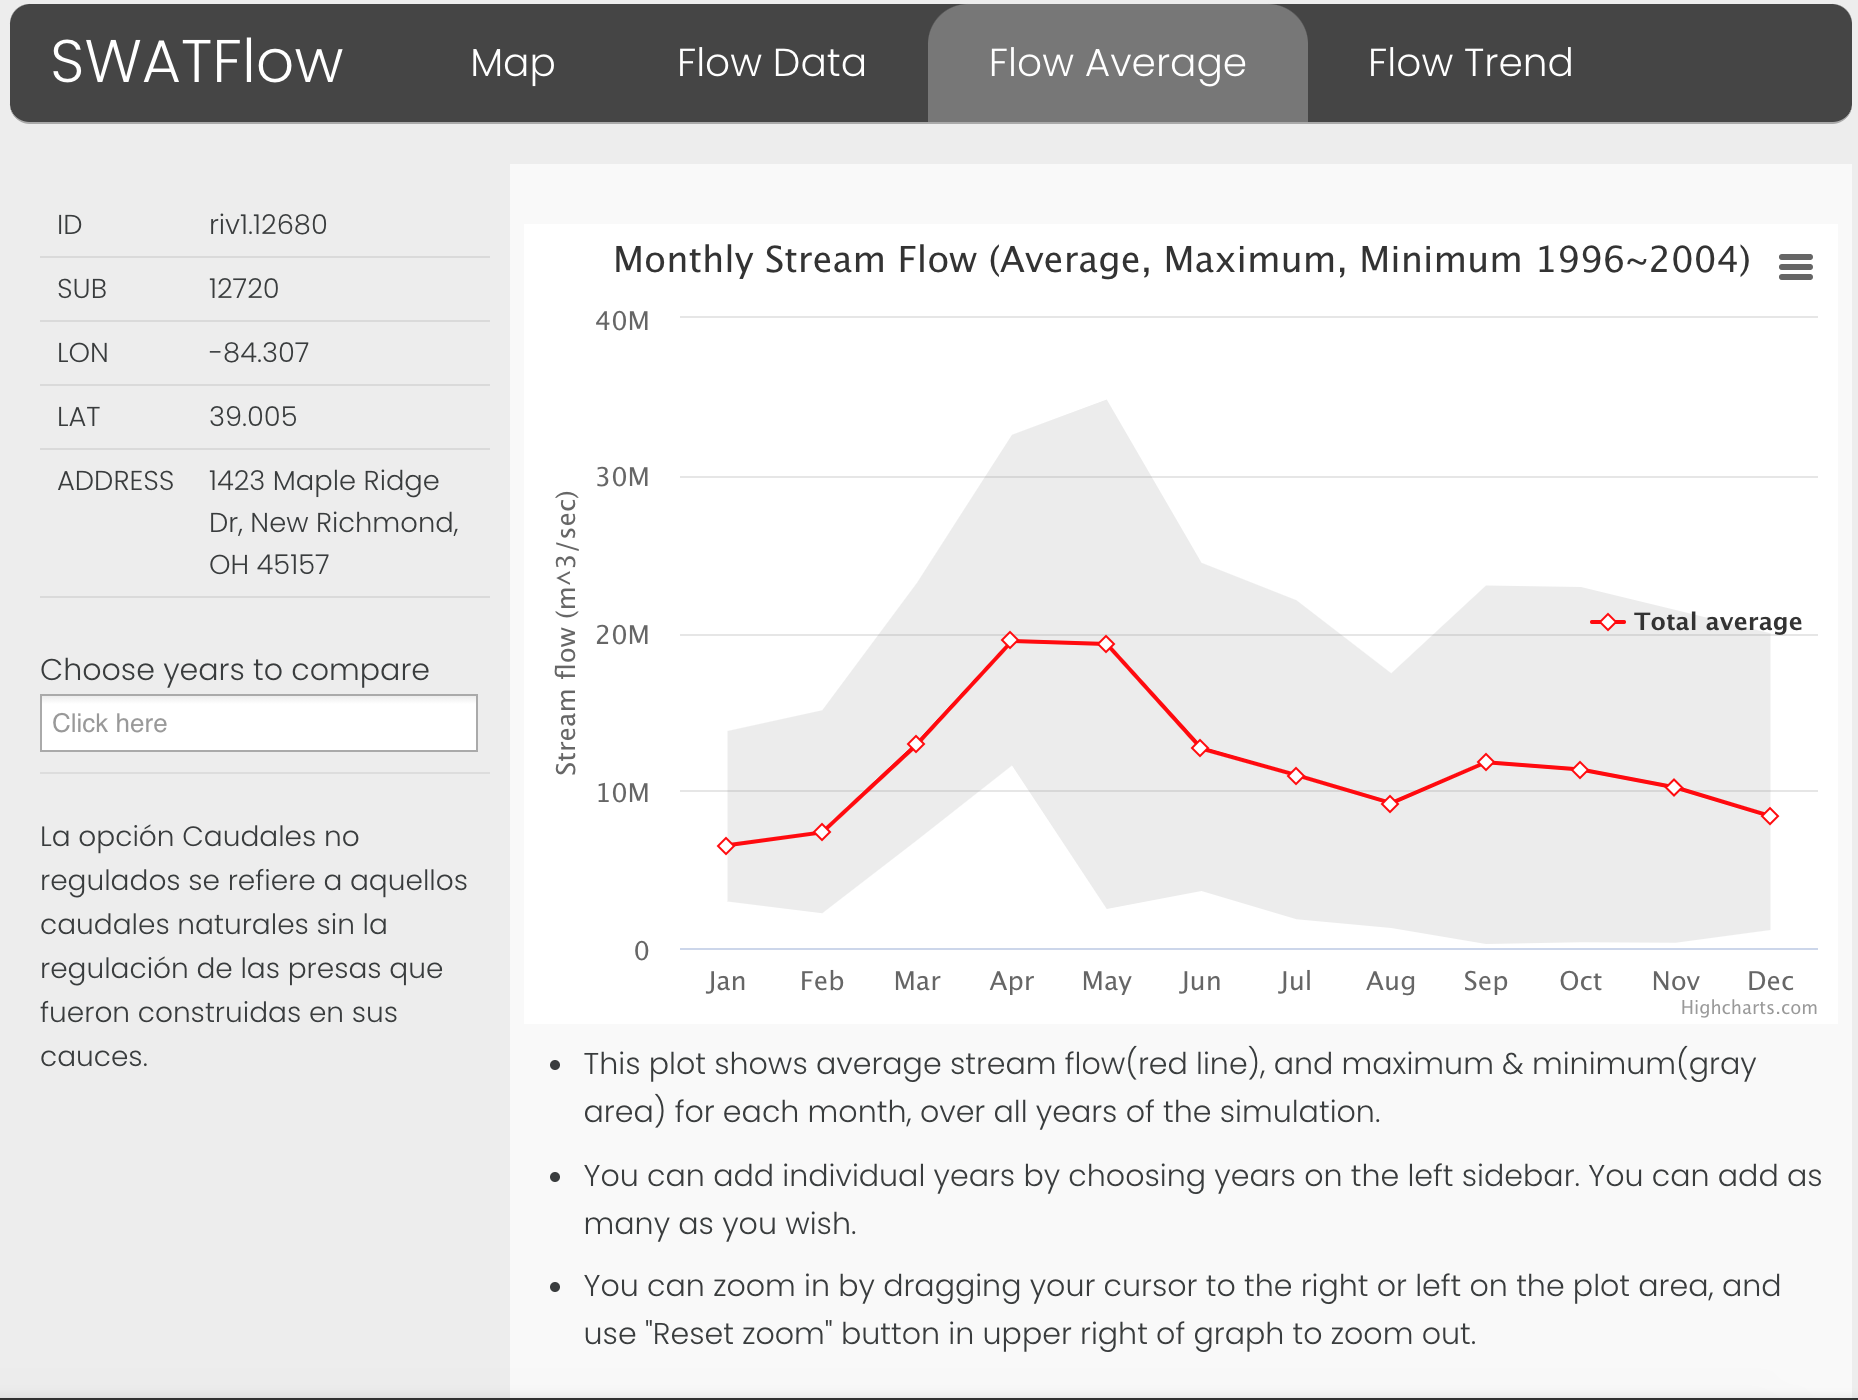
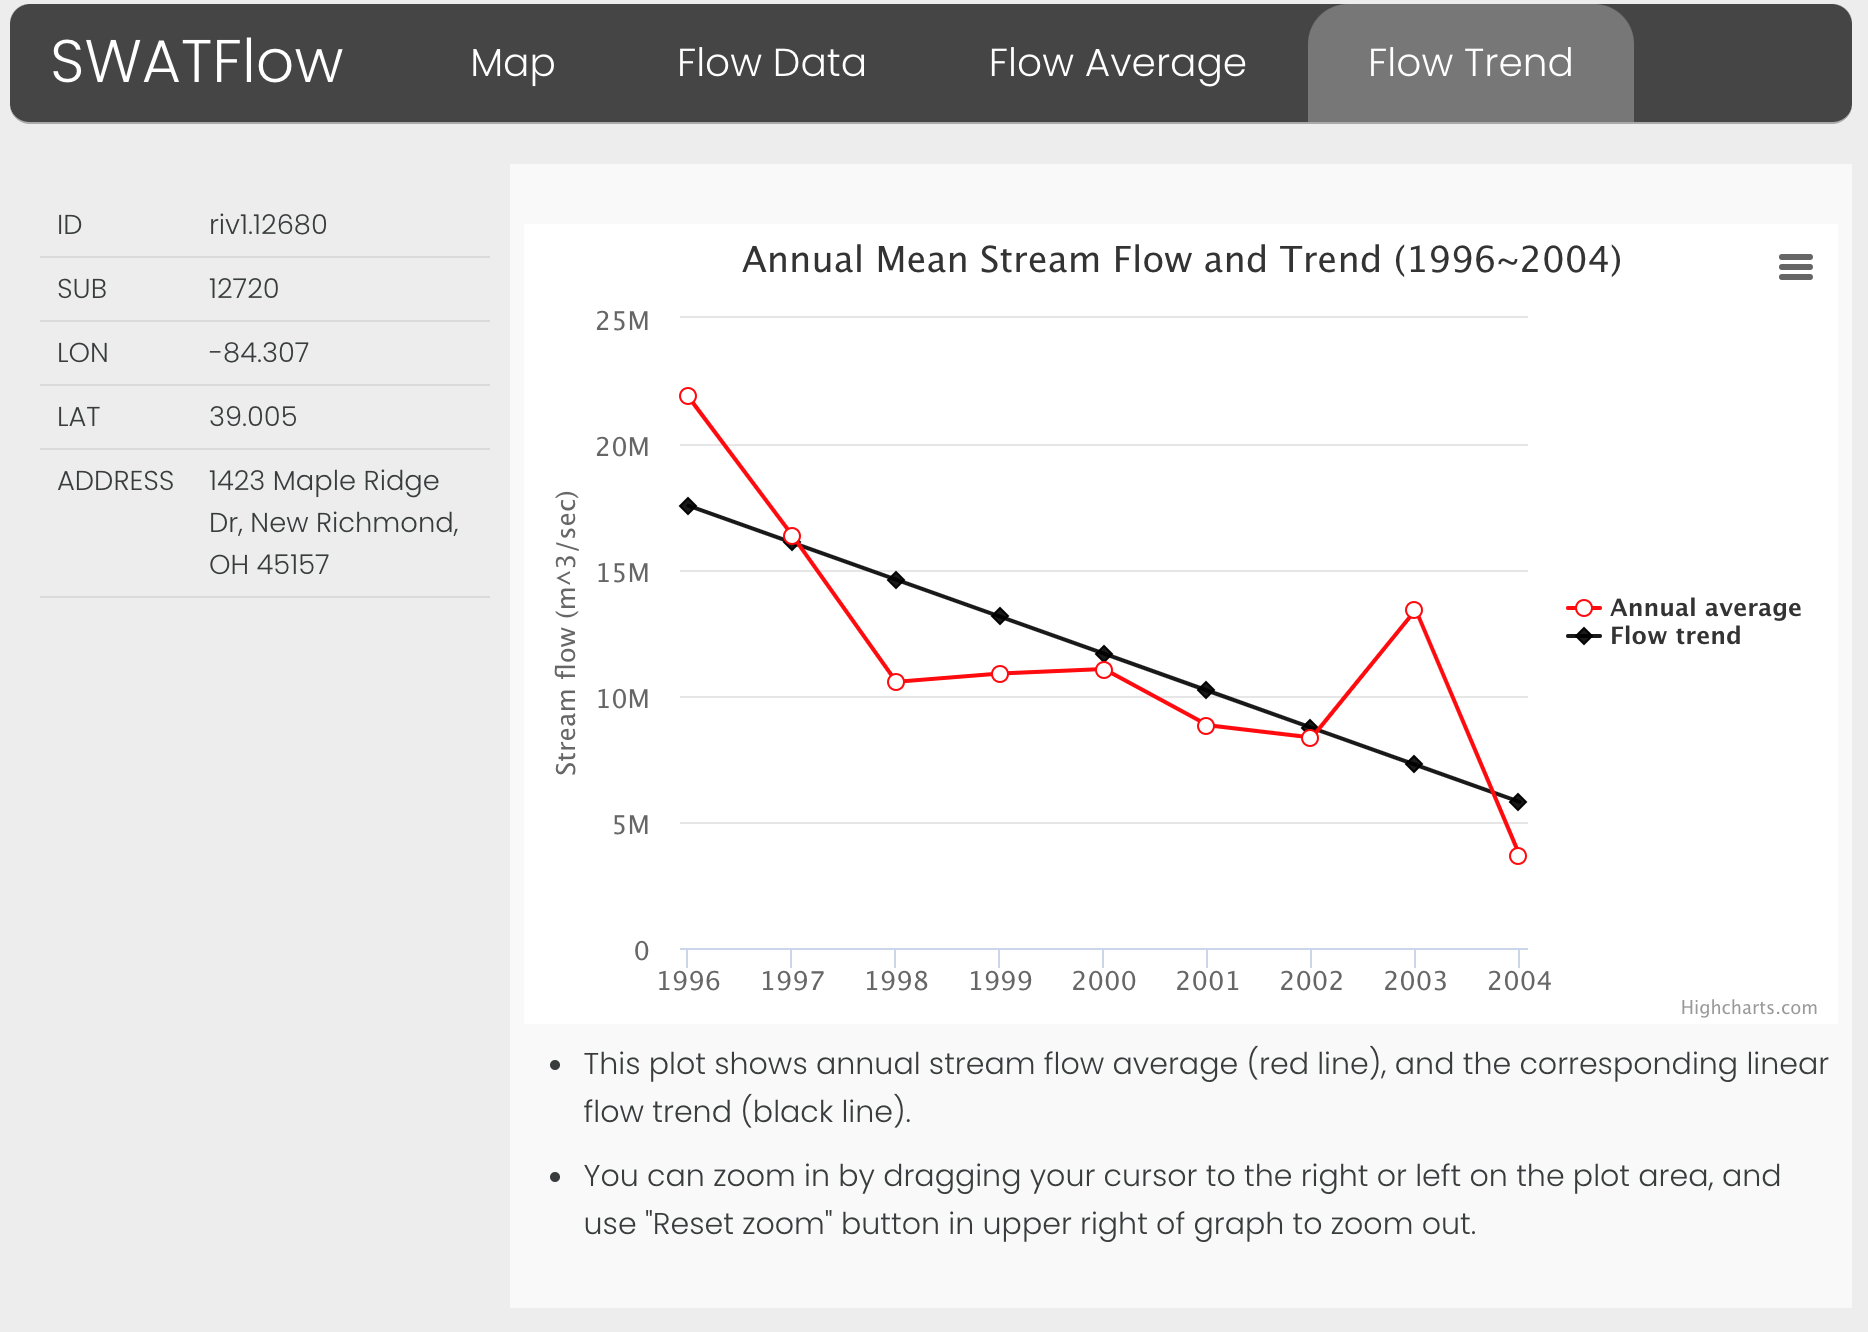
SWATFlow: SWAT Data Visualization Tool
SWATFlow is an online tool that provides high resolution river flow information for enhanced water resource management, education, and research. Users can upload their own SWAT model output and visualize the streamflow information.
Technology: JavaScript, Highchart, OpenLayer
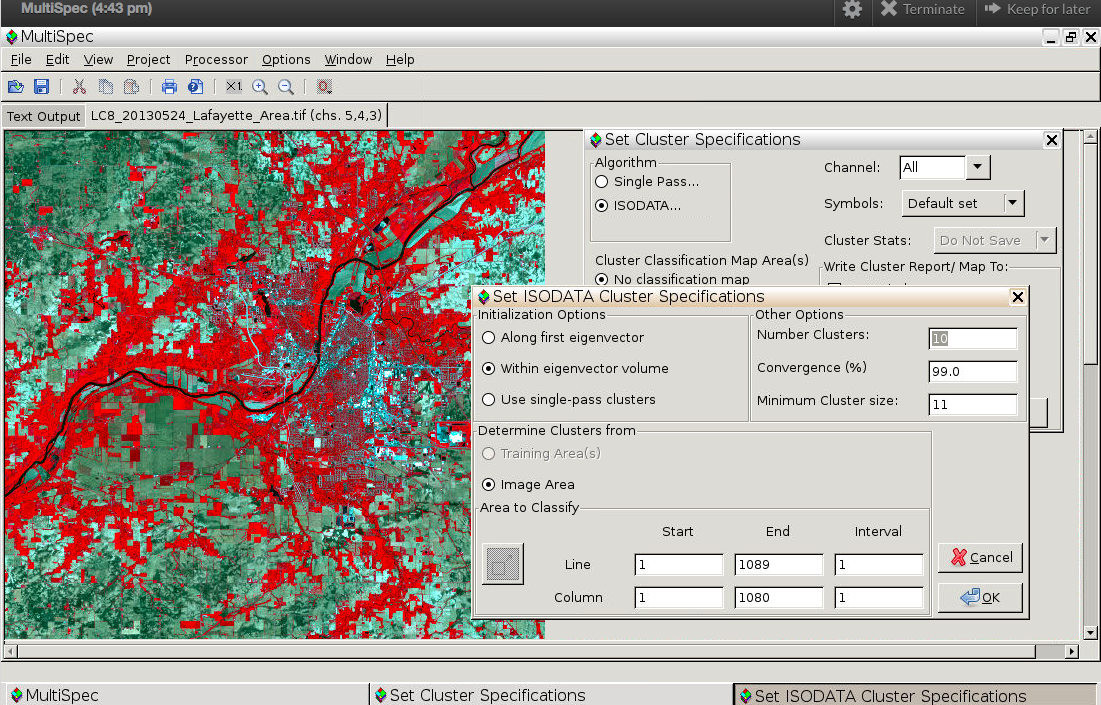
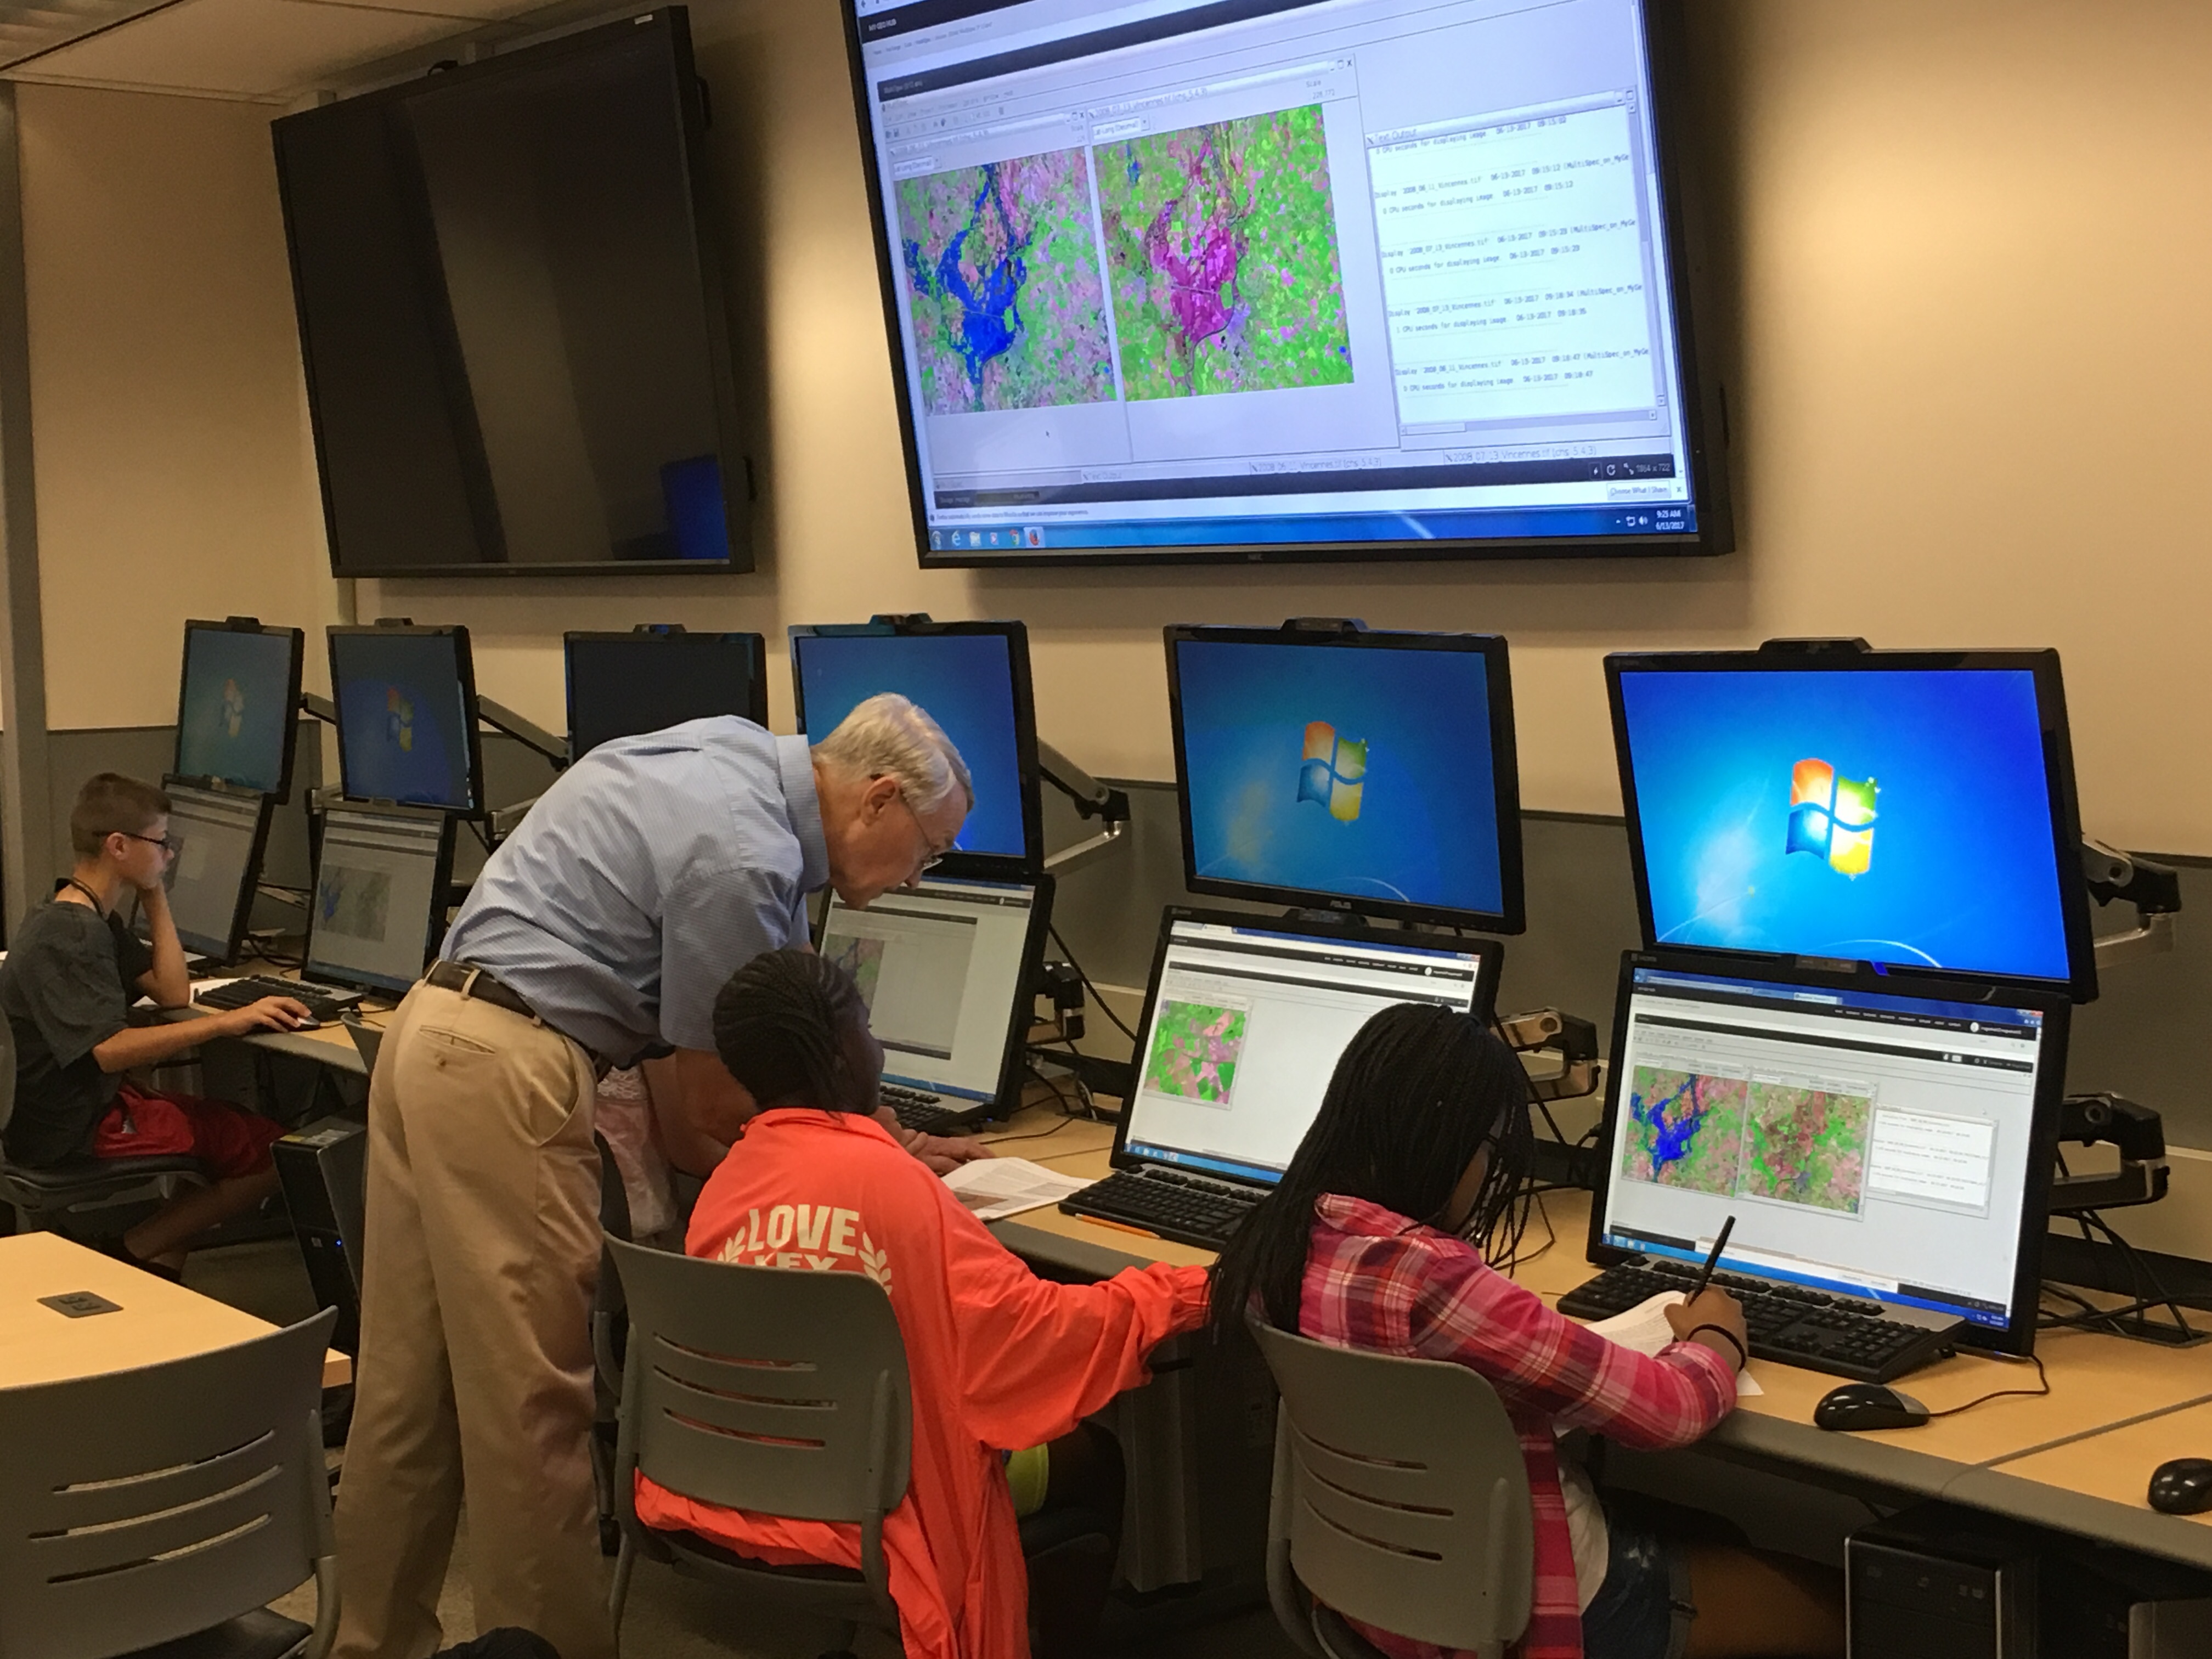
MultiSpec Image Processing
U2U Decision Support Tools
Tools that translate climate data into actionable information to help corn bell growers and farm advisors to respond to climate change.
Technology:
The current version of these tools are at the regional center. Here are the research version of the tools at Purdue:
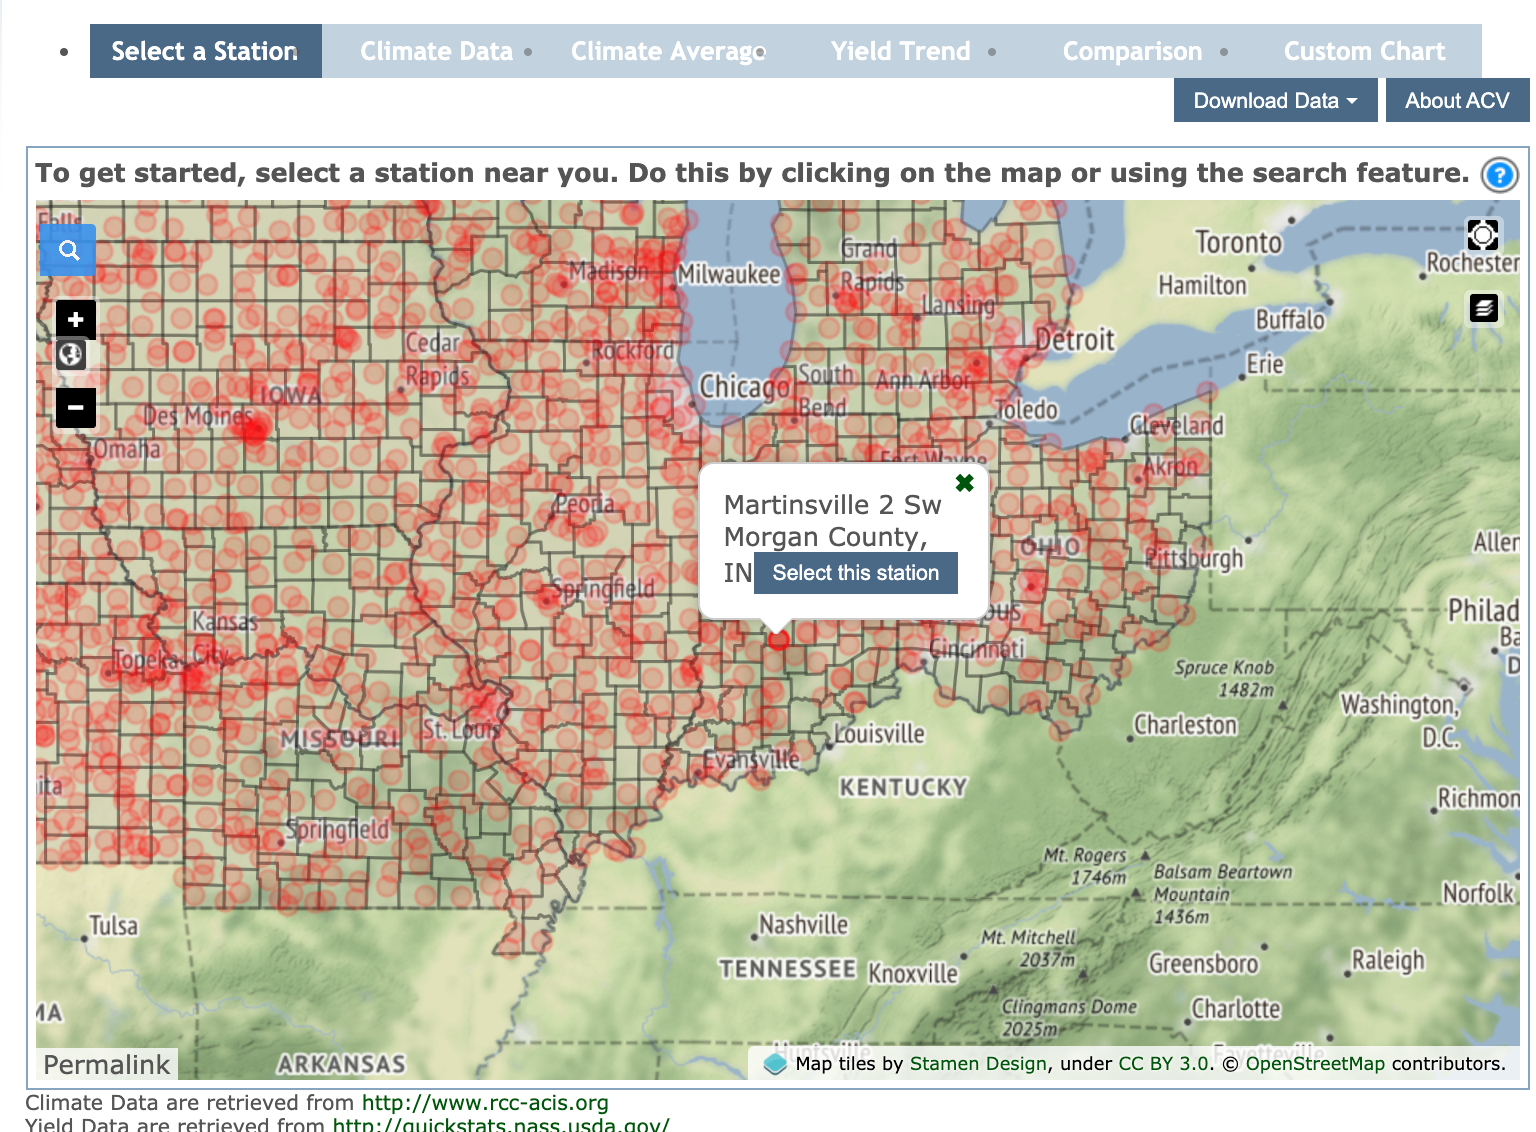
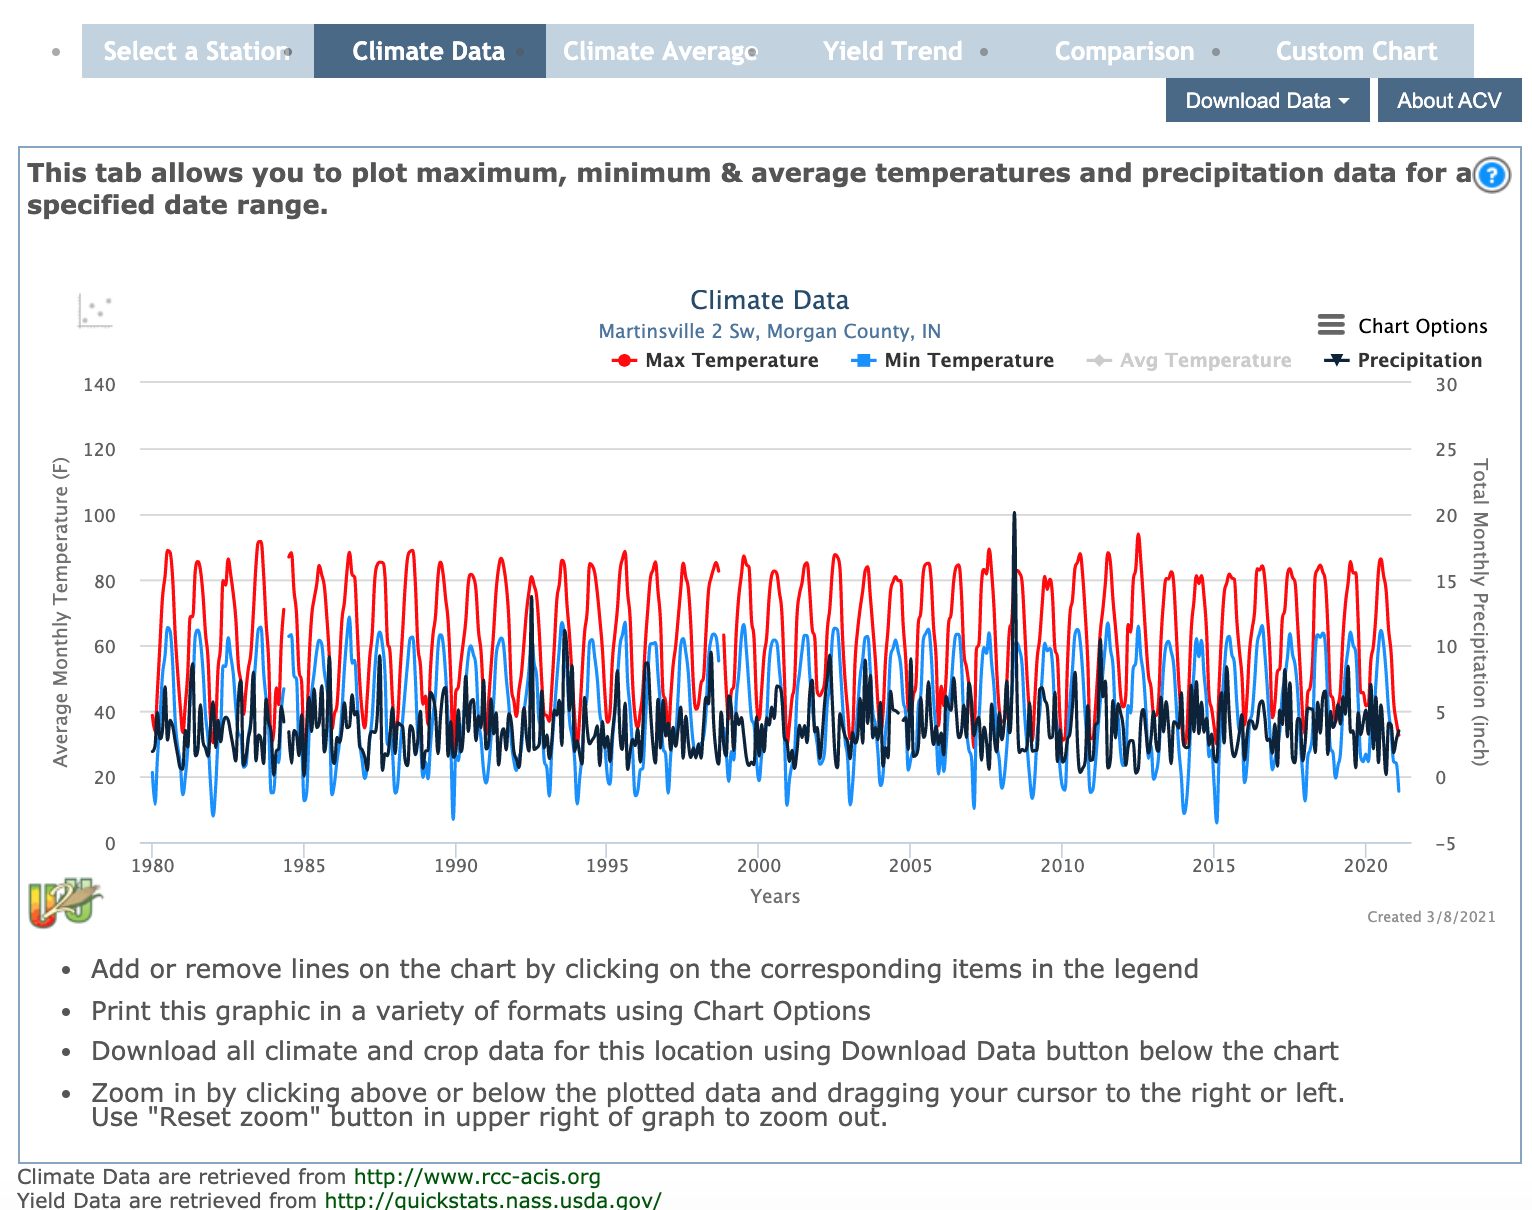
The Ag Climate Viewer tool enable users to plot local monthly temperature and precipitation variation back to 1980, track county crop yields and trends (where data is available), and consider crop yields in the context of monthly temperature, precipitation and growing degree day (GDD50) data.
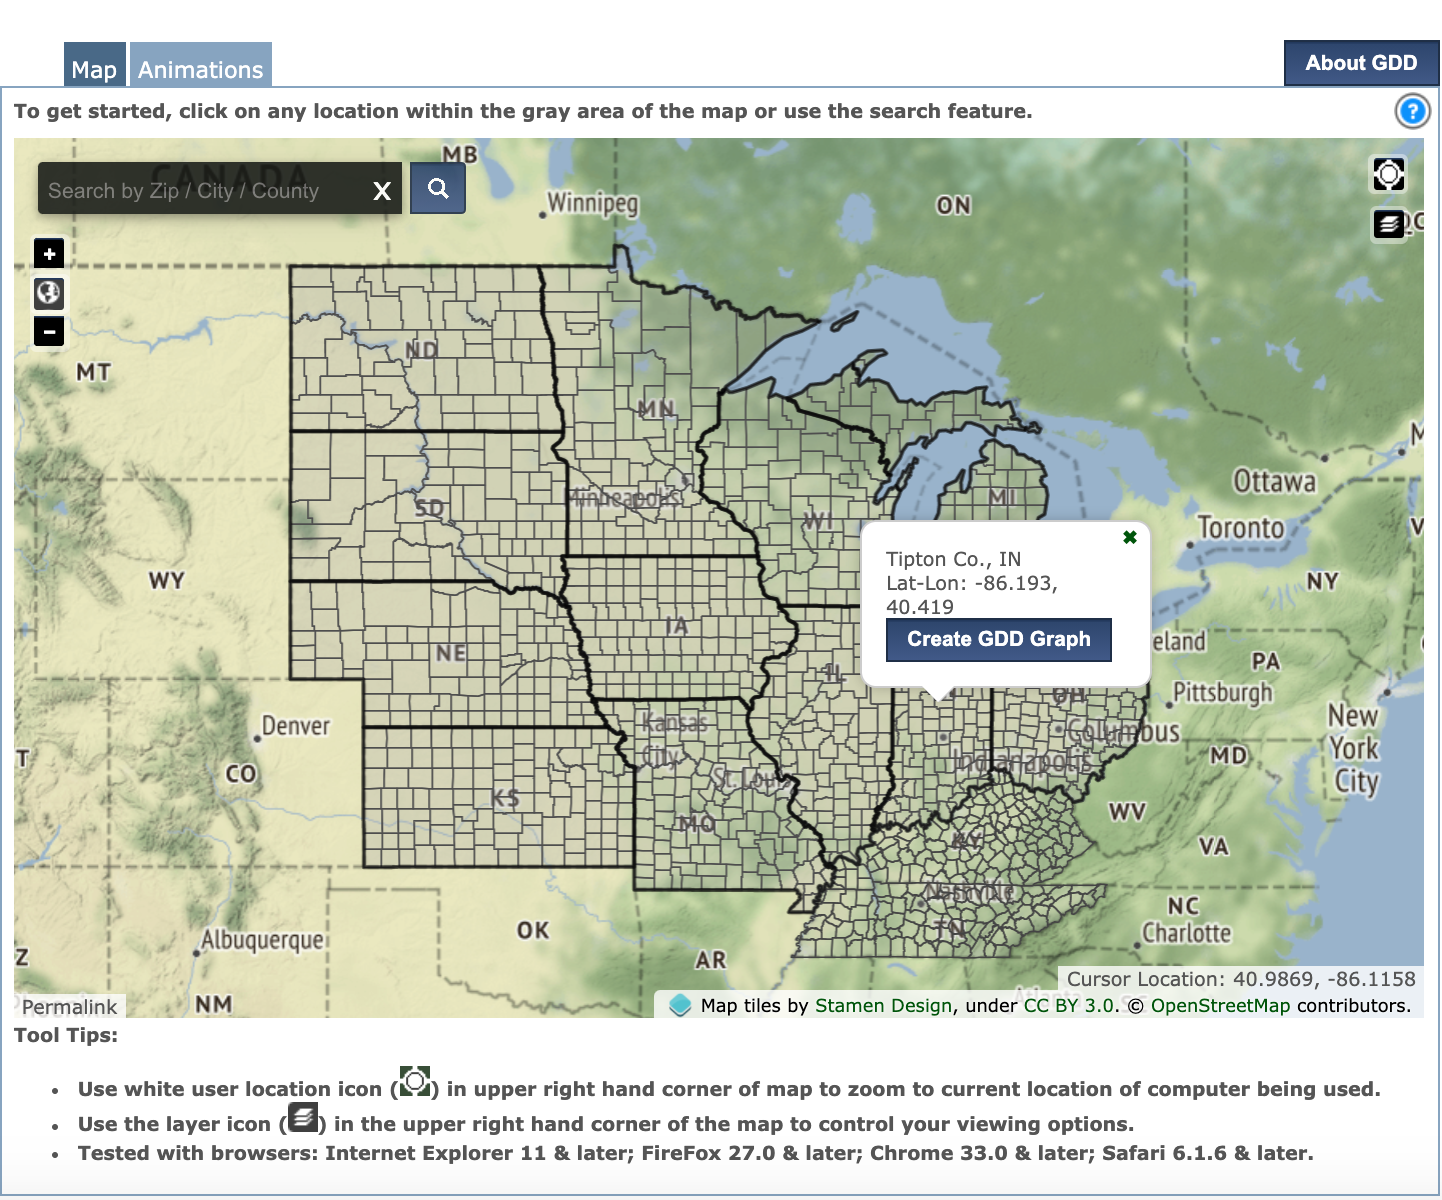
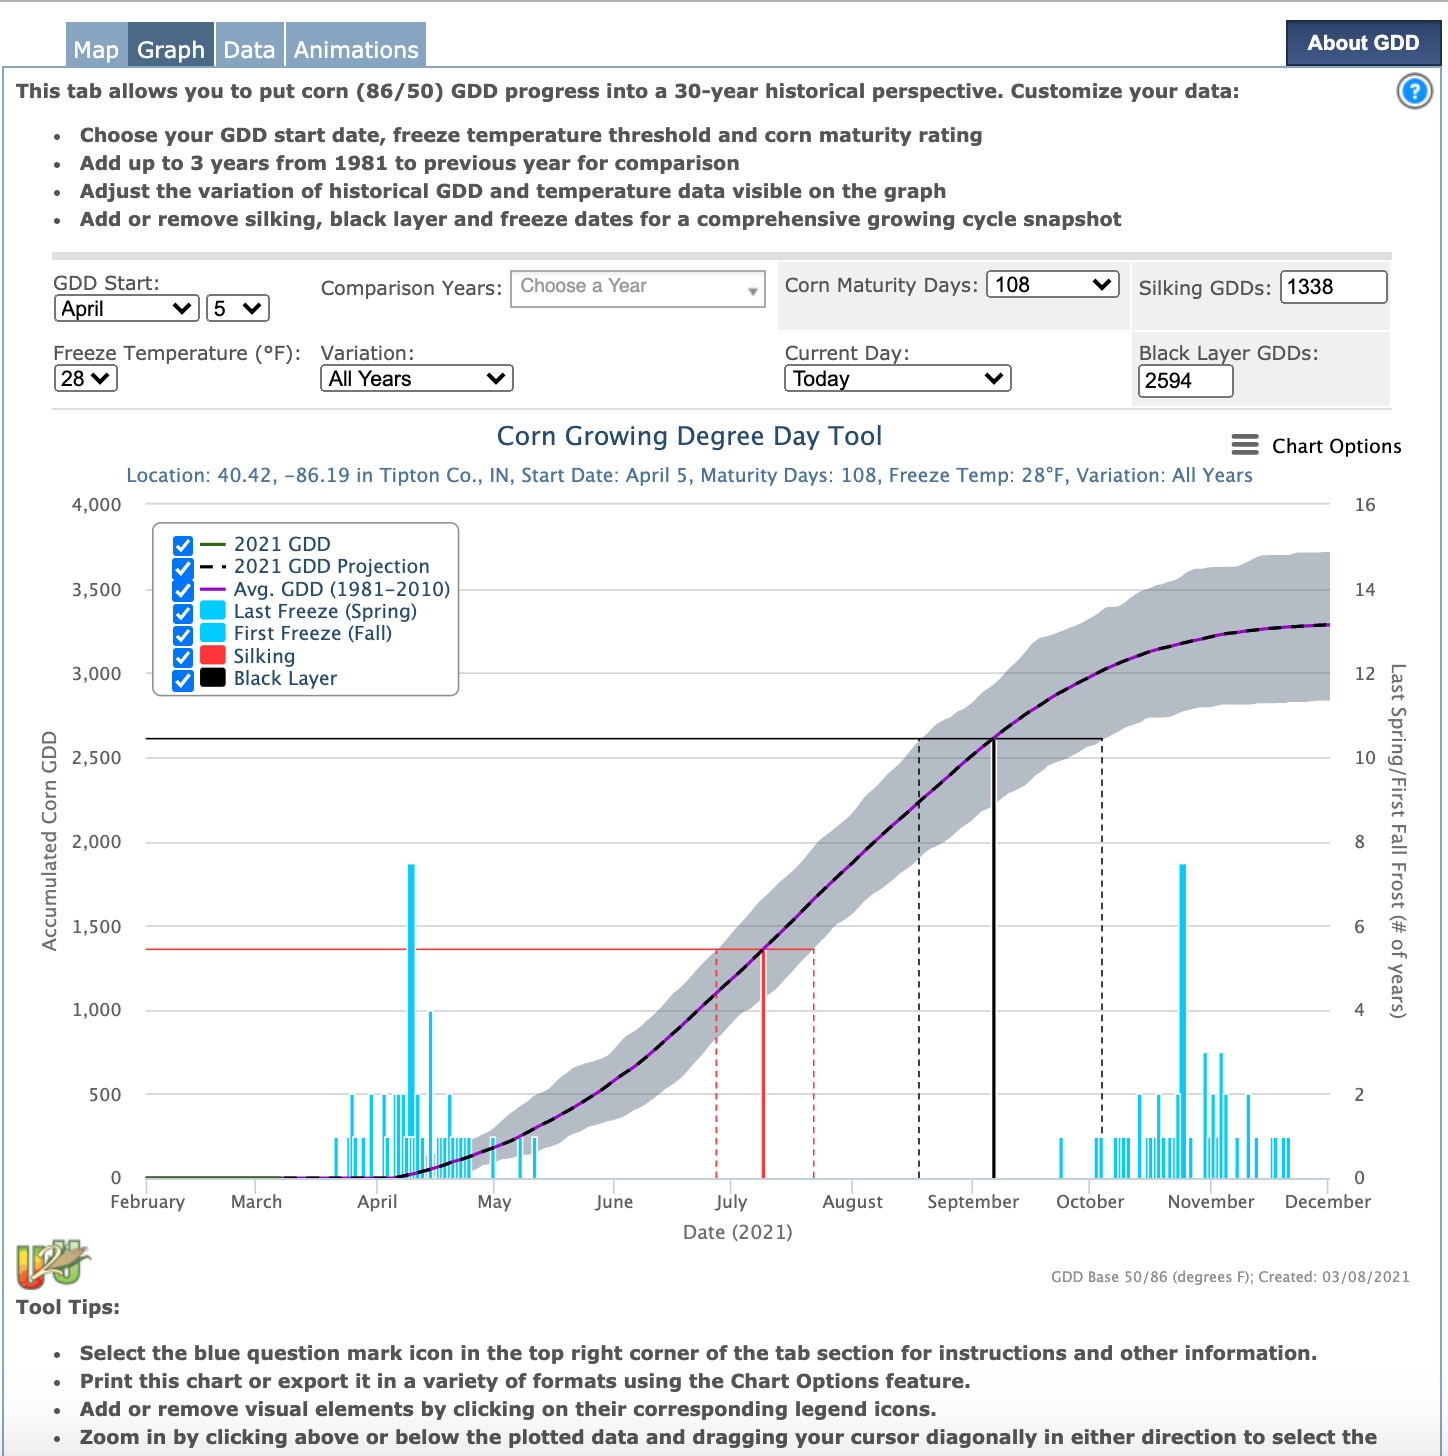
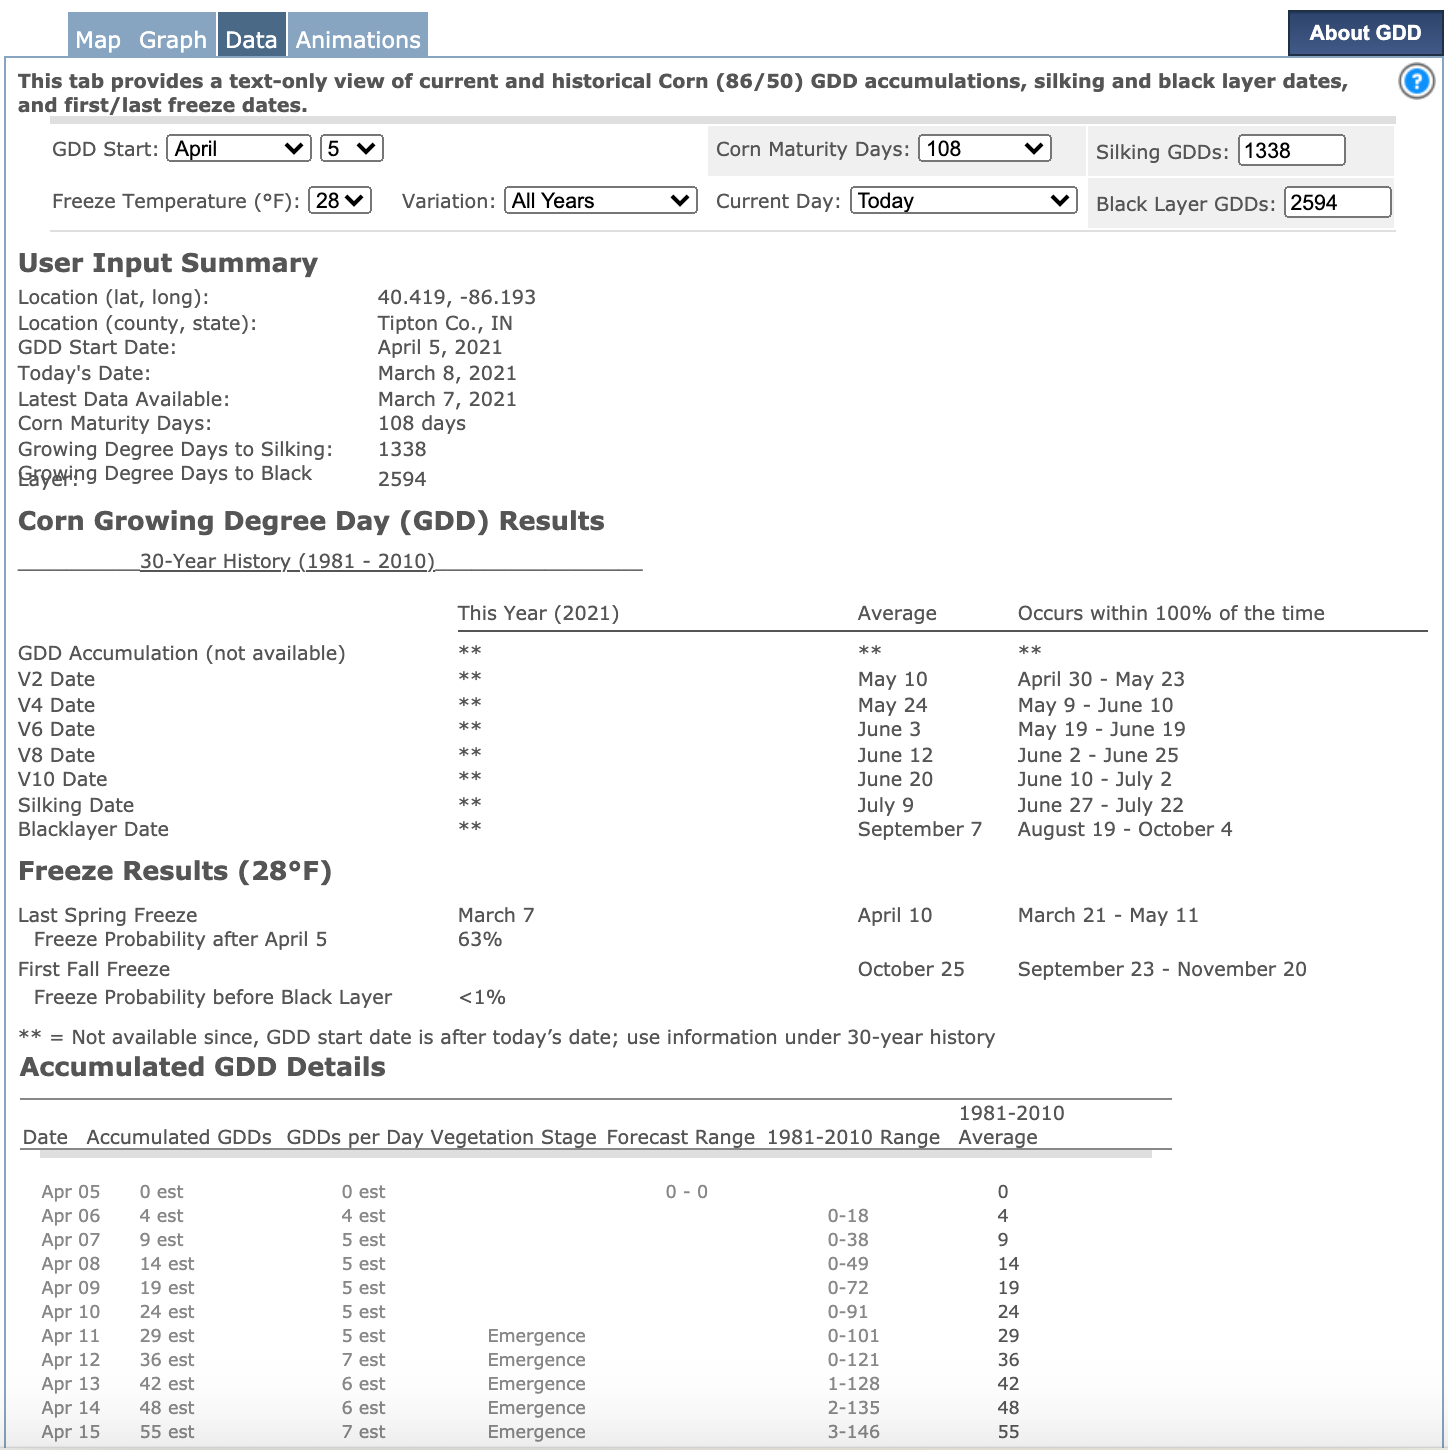
This tool puts current conditions into a 30-year historical perspective and offers trend projections through the end of the calendar year. GDD projections, combined with analysis of historical analog data, can help you make decisions about:
- Climate Risk—Identify the likelihood of early and late frost/freezes
- Activity Planning—Consider corn hybrid estimated physiological maturity requirements, along with GDD projections when making seed purchasing and other growing season decisions
- Marketing—Look at historical and projected GDD when considering forward pricing and crop insurance purchases
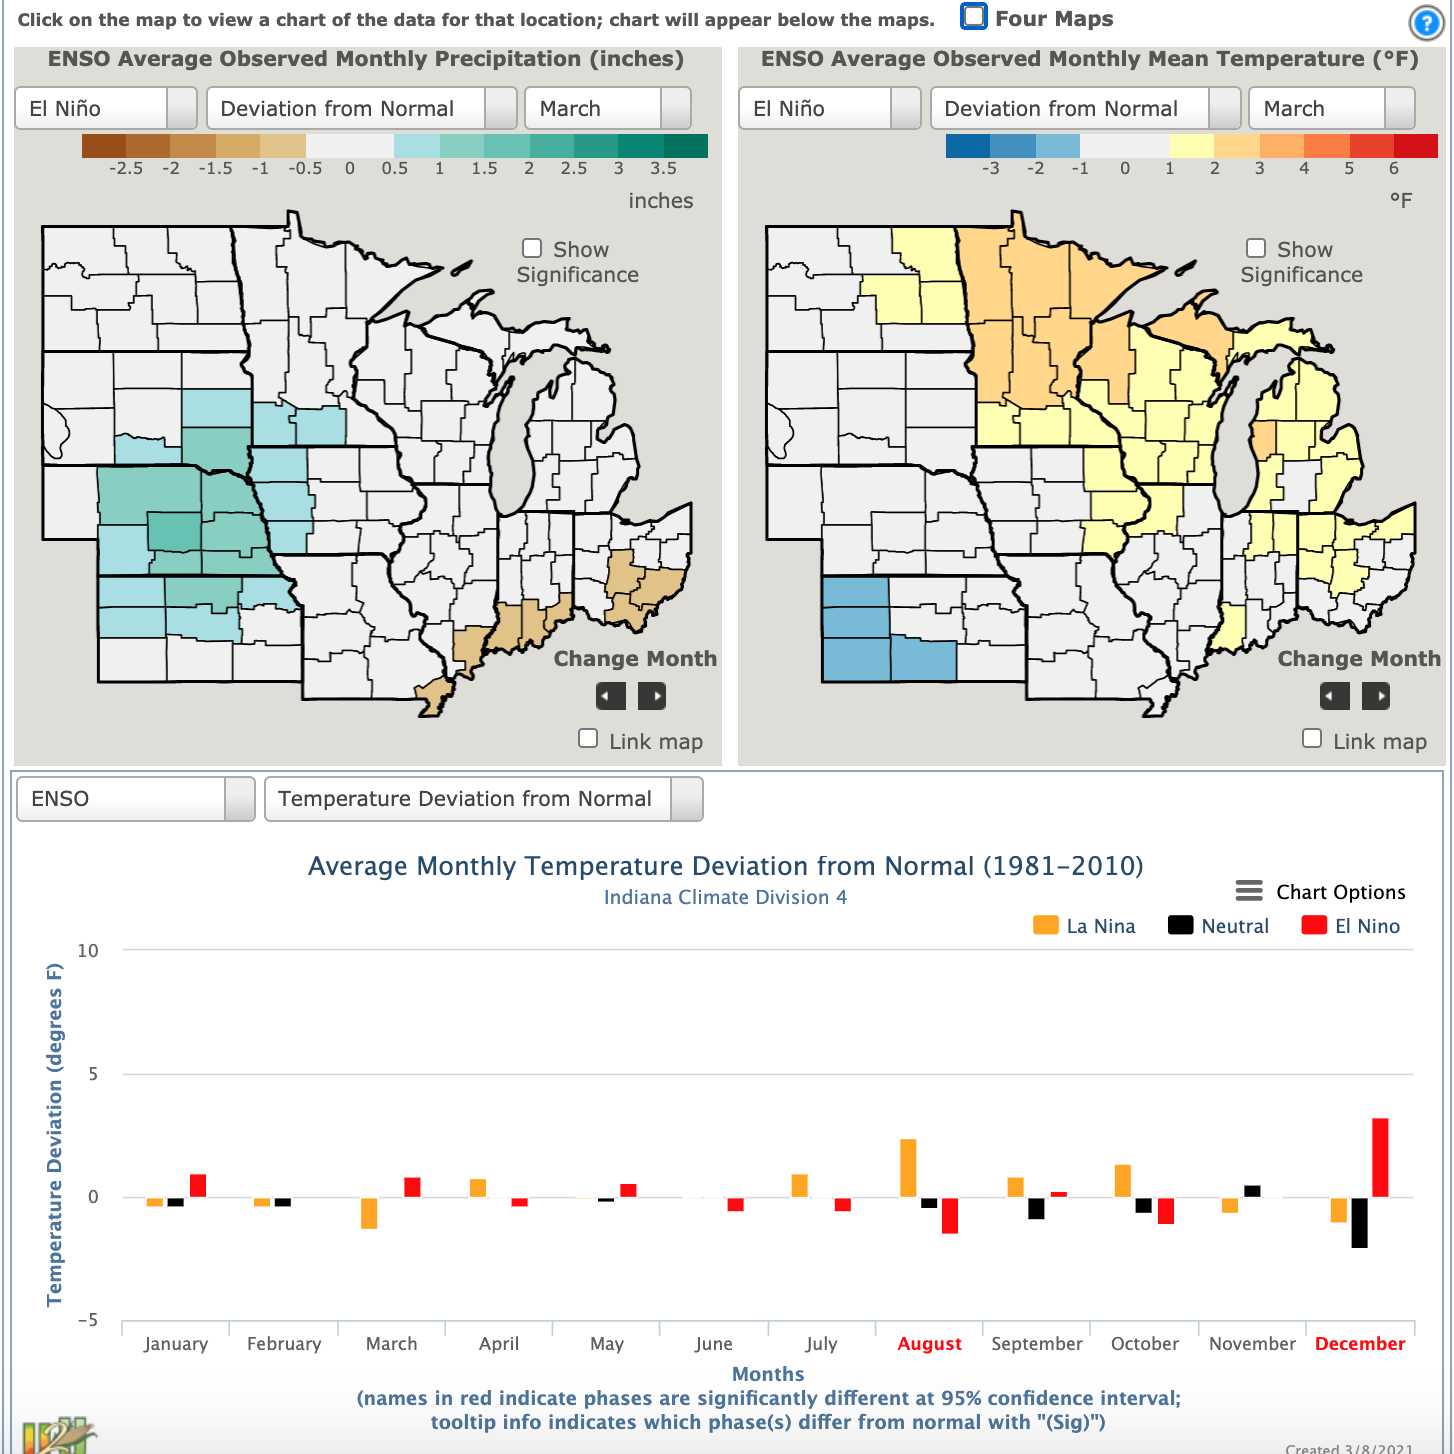
This product provides a historical look at how the El Niño Southern Oscillation (ENSO) and Arctic Oscillation (AO) can influence local climate conditions and corn yield across the Corn Belt. You can use these simple maps and charts to show when and where specific phases of ENSO or AO have influenced:
- average monthly temperatures and precipitation,
- deviations of temperature and precipitation from 1981-2010 climate normals, and
- average detrended corn yields (adjusted to 2010 technology) and deviations from average
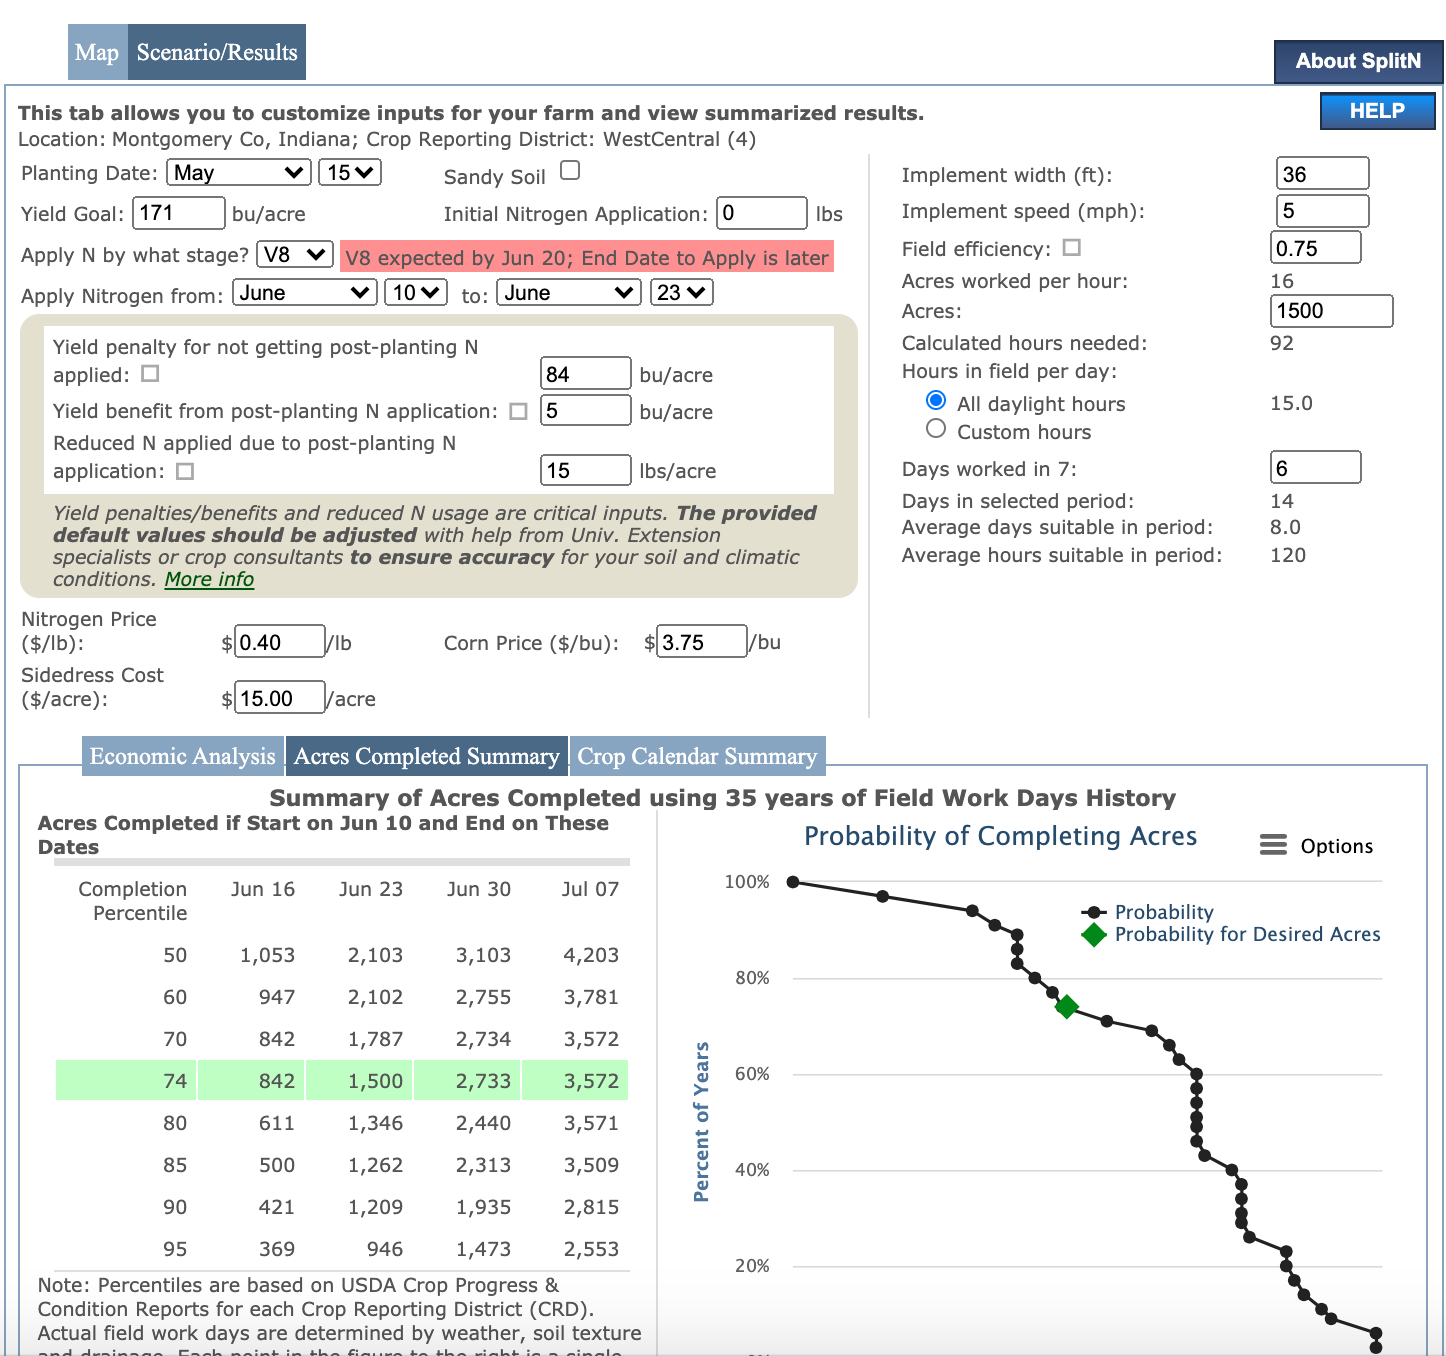
This product is designed to help farmers and farm advisors understand the risks and benefits of using post-planting nitrogen (N) application for corn production. The Corn Split N tool combines historical weather and fieldwork data with economic considerations to determine the feasibility and profitability of completing a second (split) N application within a user-specified time period. This tool may help you with decisions that:
- Increase corn yields
- Reduce nitrogen costs
- Reduce nitrogen losses to the environment
- Affect the likelihood of completing in season fieldwork
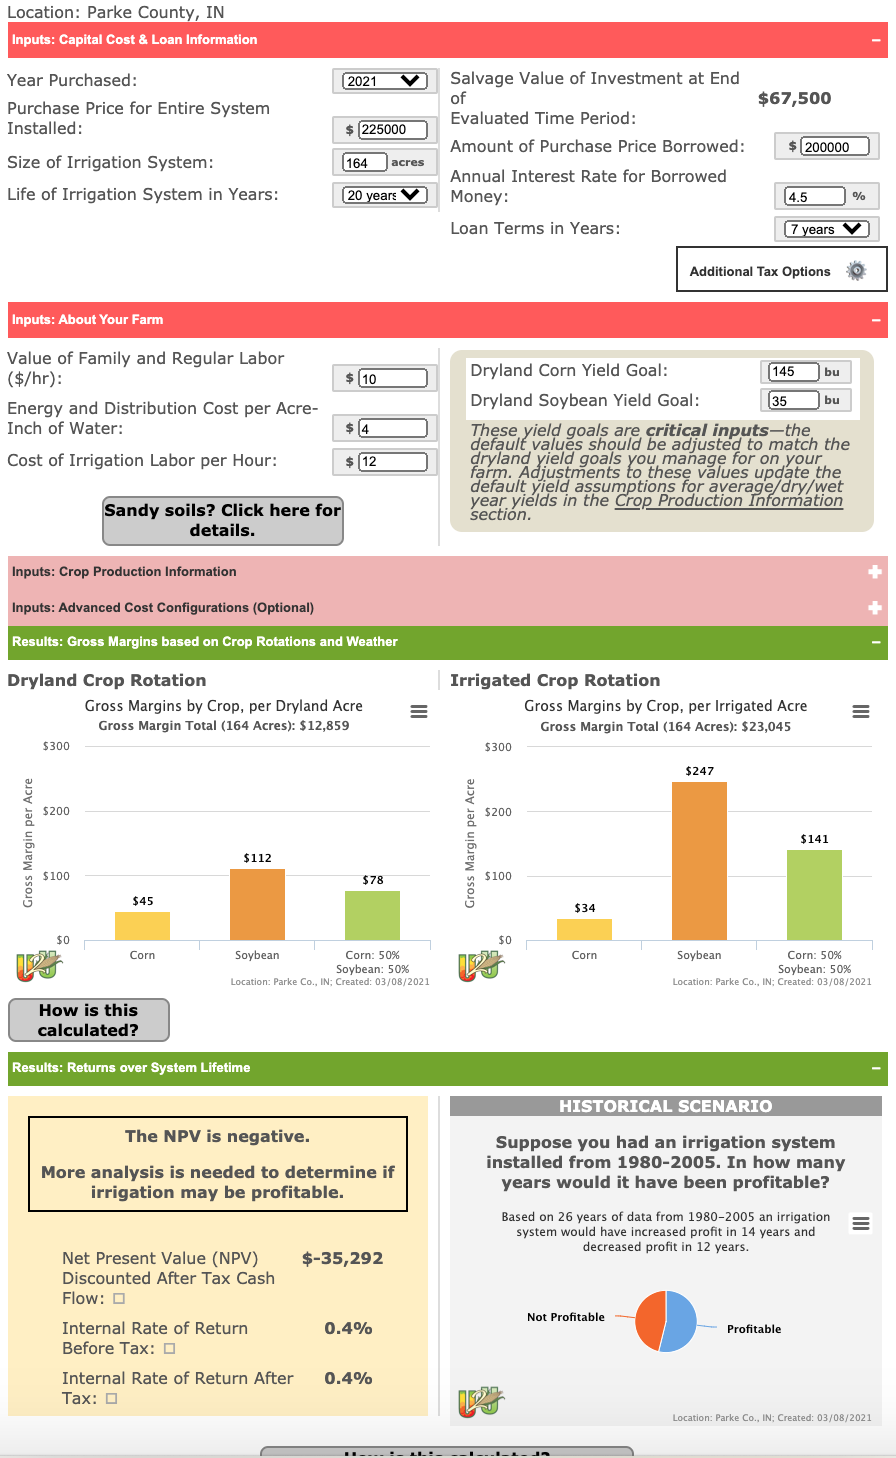
This tool lets you explore the profitability of installing irrigation equipment at user-selected locations across the Corn Belt. The Irrigation Investment DST combines historical weather data and crop simulation model data with customizable yield, cost, tax and loan information to help you evaluate whether an investment in irrigation equipment may be profitable.
Online Courses
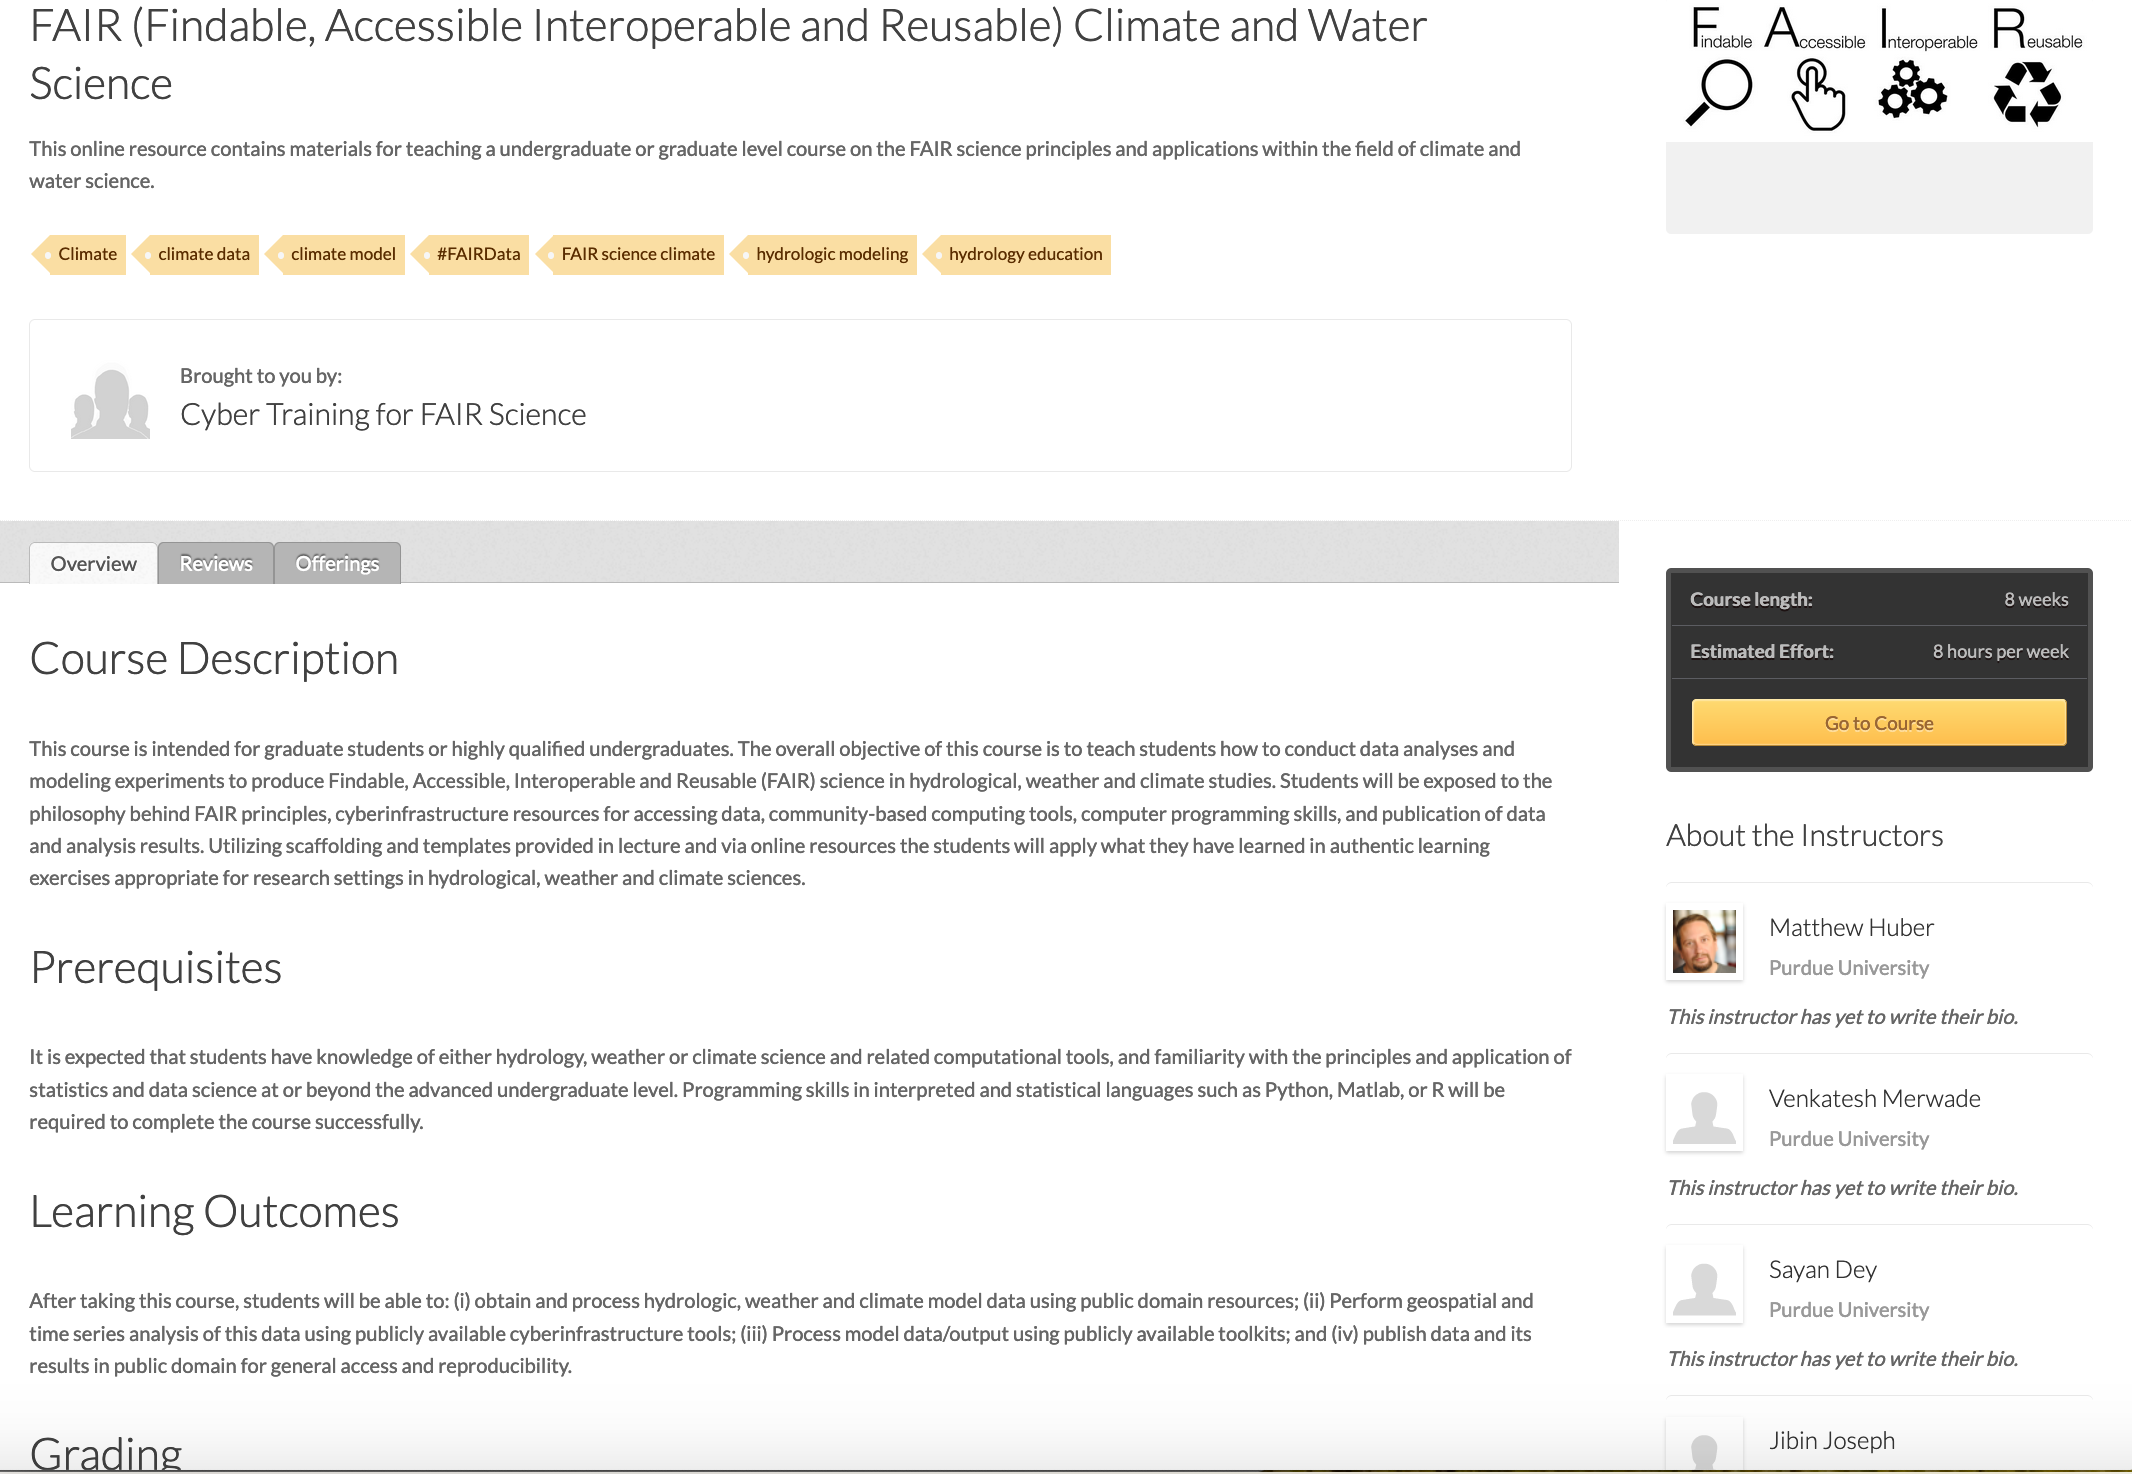
The course platform on MyGeoHub has been enhanced to integrate with dynamic data, modeling, HPC, and coding environments such as Jupyter Notebook and R Studio to facilitate advanced training and education needs.
FAIR (Findable, Accessible Interoperable and Reusable) Climate and Water Science
This online course allows students to directly launch the Jupyter Noteook tool environment and work on python scripts for data fetching, processing, and visualization tasks.
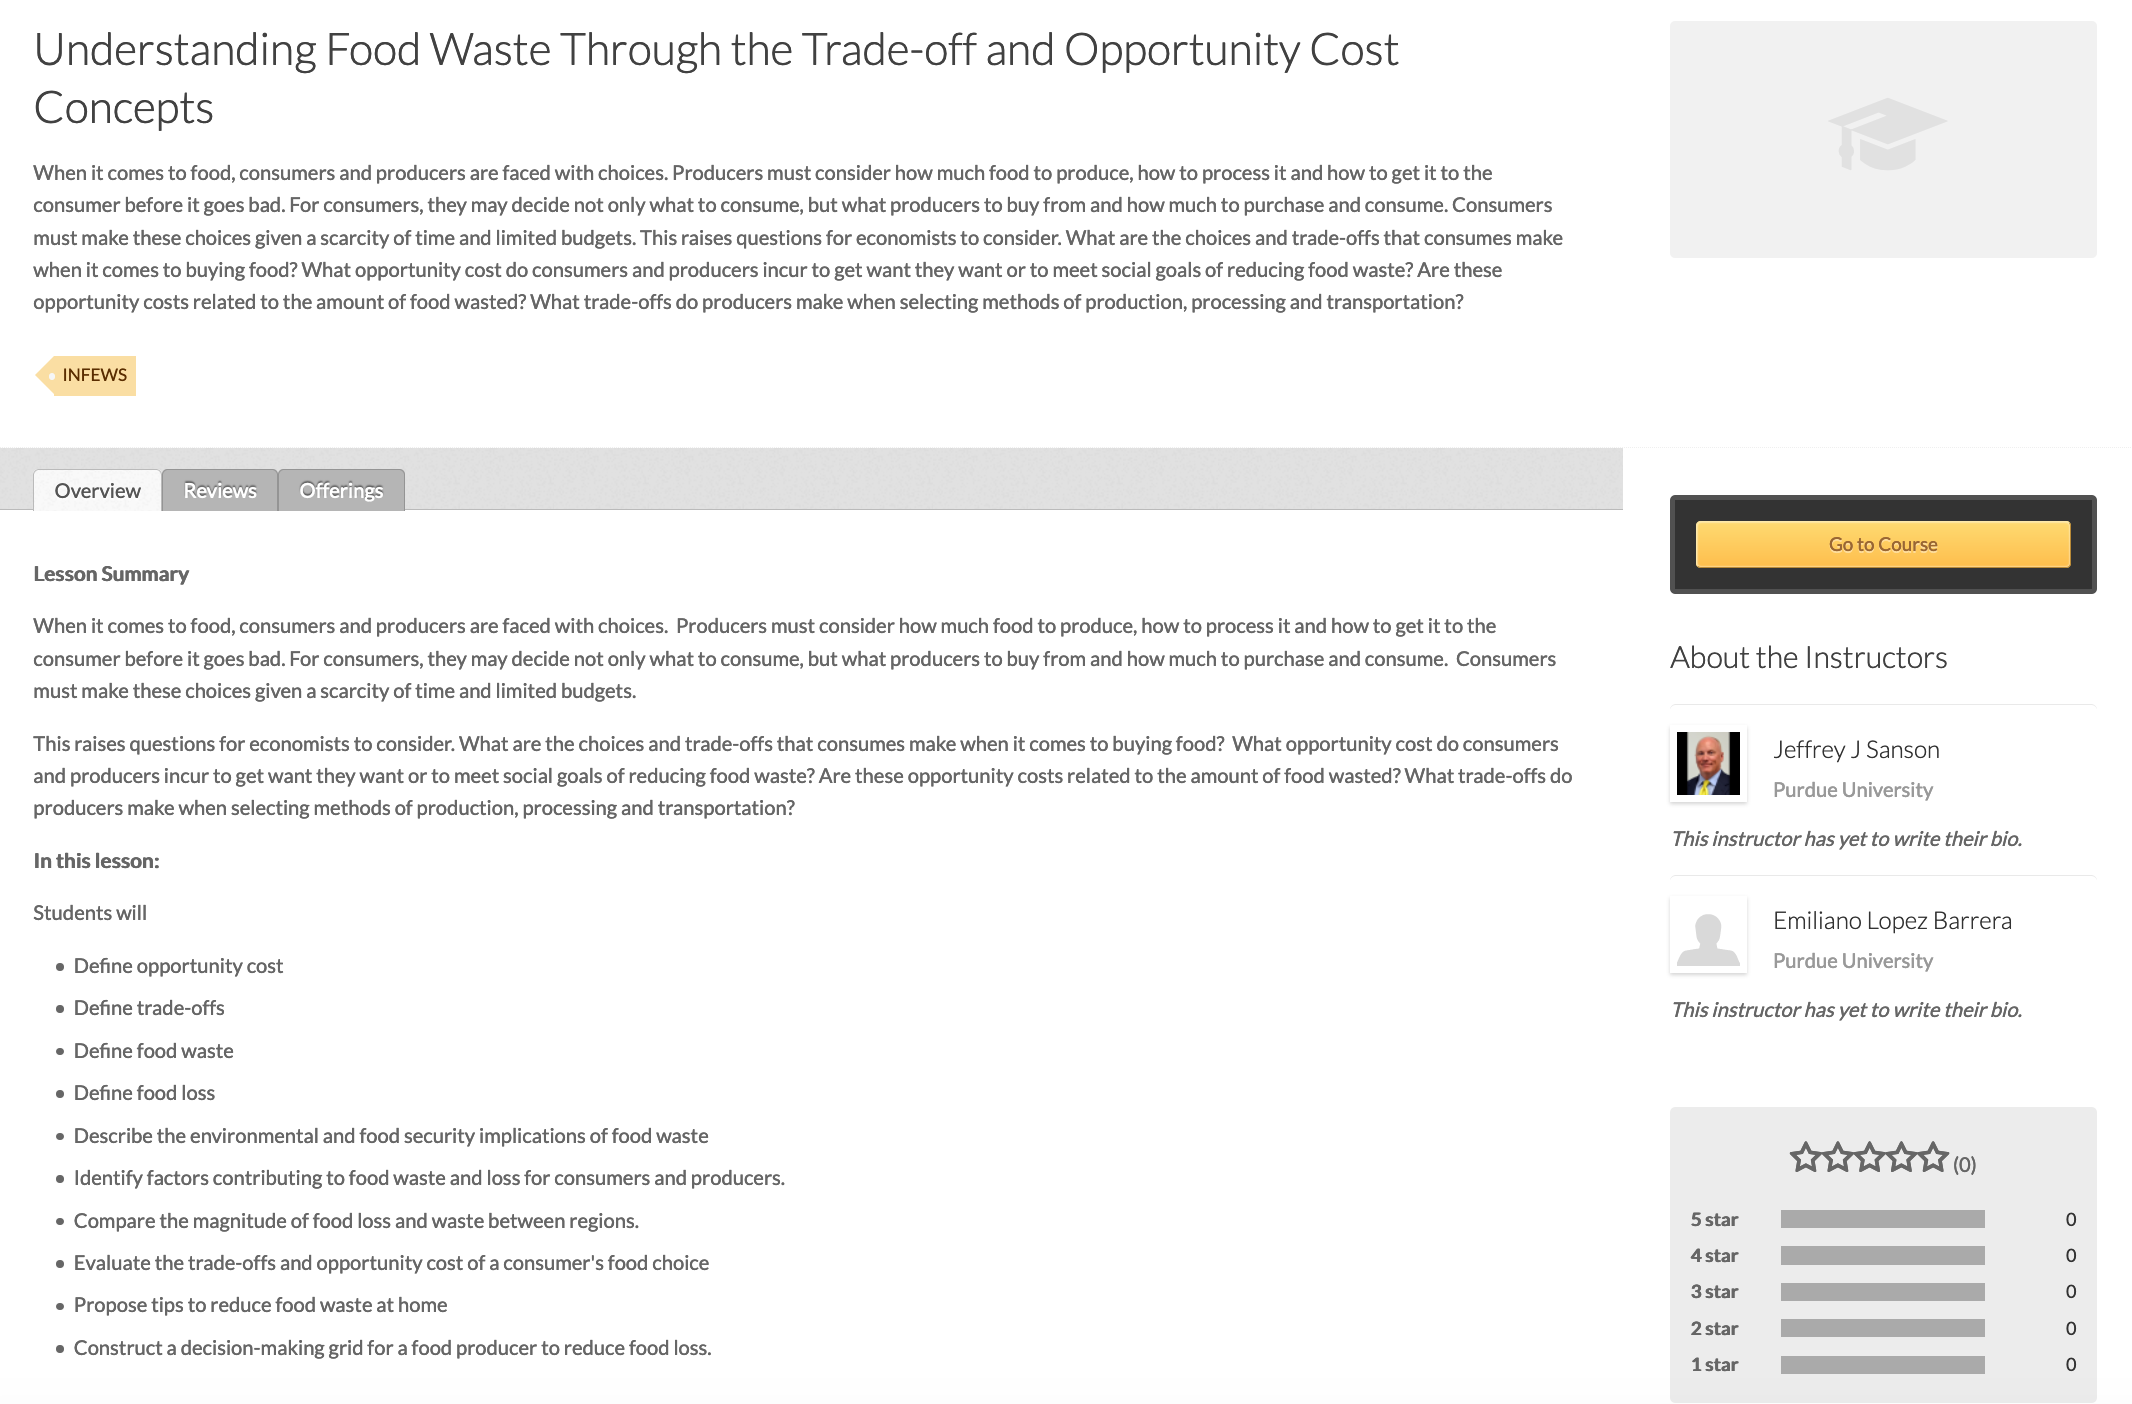
Understanding Food Waste Through the Trade-off and Opportunity Cost Concepts
This online course allows students to learn the tradeoffs and opportunity cost of a consumer's food choice, as well as to construct a decision-making grid for a food producer to reduce food loss.
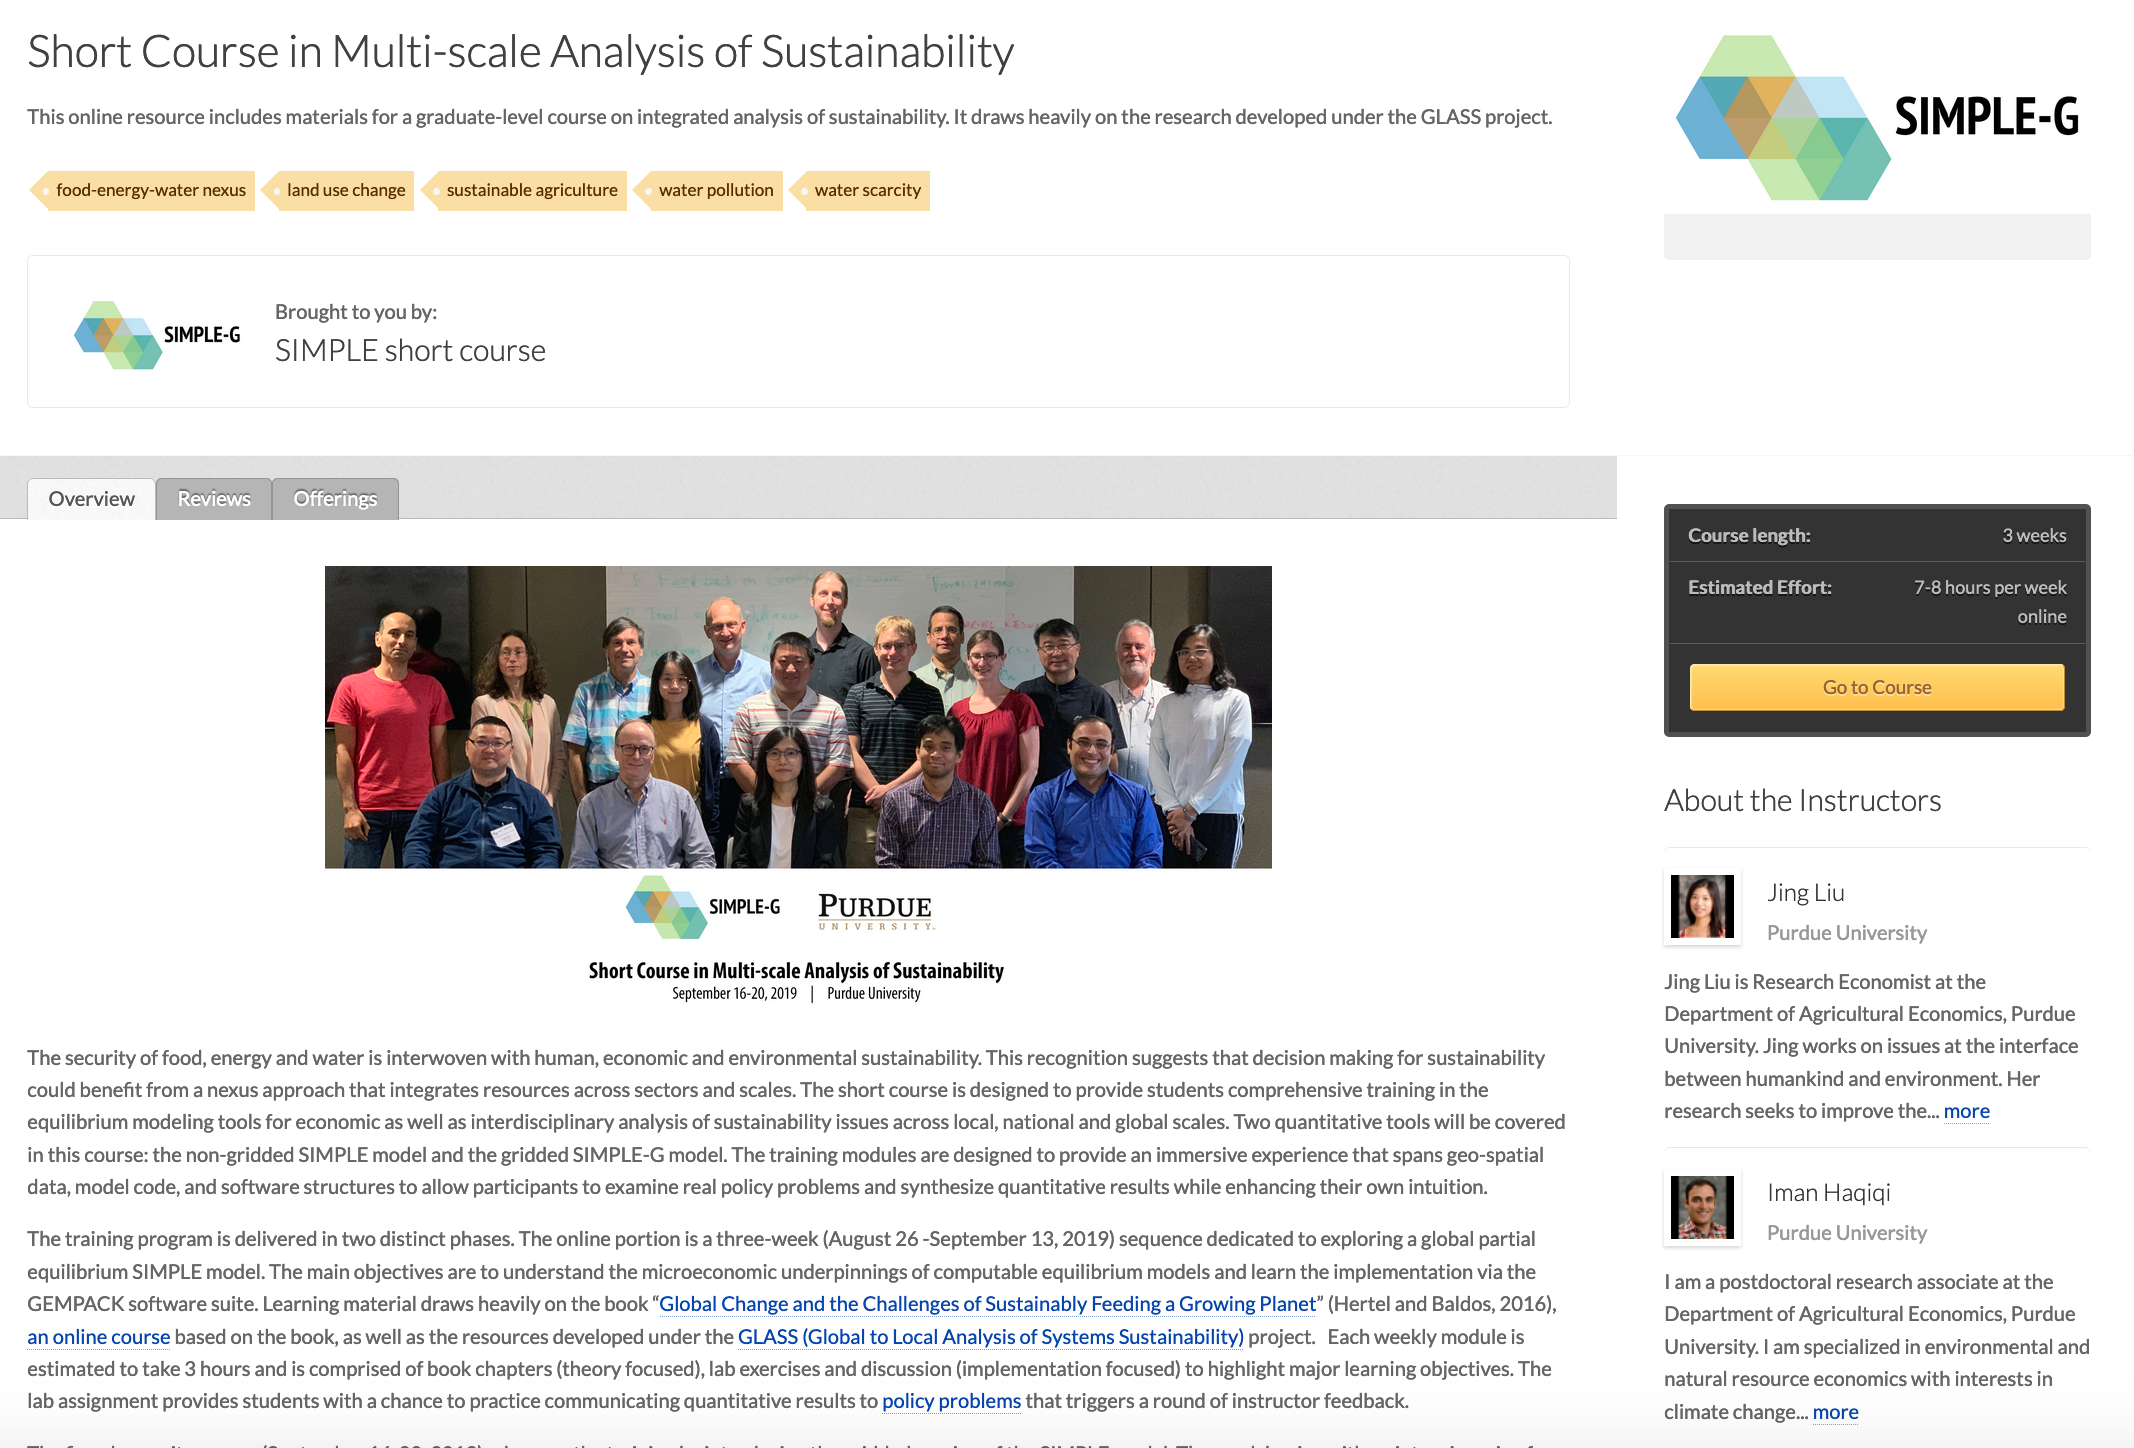
Short Course in Multi-scale Analysis of Sustainability test
This online resource includes materials for a graduate-level course on integrated analysis of sustainability. It draws heavily on the research developed under the GLASS project.
